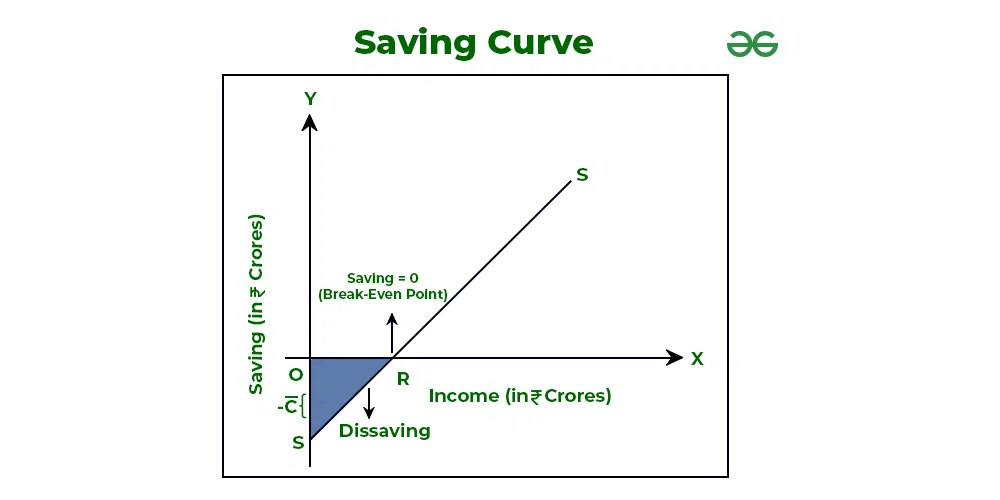
The functional relationship between saving and national income is known as Saving Function. It shows the savings of households during a given period of time at a given income level. In alternate terms, the savings function shows different savings levels at different income levels in an economy. Saving function is also known as Propensity to Save and is represented by S = f(Y); where S = Saving, Y = National Income, and f = Functional Relationship.
Let’s understand the concept of Saving Function with the help of the following saving schedule and saving curve.
Saving Schedule:
| Income (Y) (₹ Crores) | Consumption (C) (₹ Crores) | Saving (S) (₹ Crores) |
|---|---|---|
| 0 | 80 | -80 |
| 100 | 140 | -40 |
| 200 | 200 | 0 |
| 300 | 260 | 40 |
| 400 | 320 | 80 |
| 500 | 380 | 120 |
| 600 | 440 | 160 |
The above schedule shows saving at different income levels.

In the above graph, X-axis represents National Income and Y-axis represents Saving.
Observation:
1. Starting Point: The saving curve (SS) starts from point S on Y-axis and not from point O, which means that at zero income level, there is a negative saving equal to the amount of autonomous consumption.
2. Slope of Saving Curve: The slope of the saving curve SS is positive, which means that there is a positive relationship between saving and income.
3. Break-even Point; i.e., S = 0: The saving curve SS crosses the X-axis at point R, which is the break-even point. This point is known as the break-even point because here, saving is zero, or consumption is equal to income. In the above example, break-even point occurs at ₹200 Crores income level.
4. Positive Saving: After the break-even point; i.e., after S = 0, saving is positive.
The saving curve will have a negative intercept on Y-axis which is of the same magnitude as the positive intercept of consumption curve on Y-axis. It is because if at zero income level, consumption is positive, then it means that there is dissaving of the same magnitude.
Types of Propensities to Save
The two types of Propensities to Save are Average Propensity to Save (APS) and Marginal Propensity to Save (MPS).
1. Average Propensity to Save (APS):
It is the ratio of saving to the corresponding income level. The formula to determine Average Propensity to Save (APS) is:
Average Propensity to Save can never be one or more than one; however, it can be zero. The point at which the APS is equal to zero is known as the break-even point. Also, the average propensity to save increases with the increase in income because the income proportion saved keeps on increasing.
2. Marginal Propensity to Save (MPS):
It is the ratio of the change in saving to the change in total income. The formula to determine Marginal Propensity to Save (MPS) is:
Marginal Propensity to Save varies between 0 and 1. If the whole additional income is saved then MPS will be equal to one, and if the whole additional income is consumed then MPS will be equal to zero.
Equation of Saving Function
The equation of linear consumption function can be used to derive the equation of Saving Function.
As we know,
S = Y – C …………………..(1)
and C=(\bar{c})+b(Y) …………………..(2)
By putting the value of (1) in (2), the equation of Saving Function will be:
Where,
S = Saving
= Negative saving at zero income level
1 – b = MPS
Y = National Income
As the above equation is a straight line with intercept (-\bar{c}) and slope ‘1 – b’, it is a case of the linear saving function. The equation of the saving function can be used to prepare the saving curve by calculating saving expenditure at different income levels, if the value of (-\bar{c}) and (1-b); i.e., MPS is given. For example, If the value of (-\bar{c}) and 1 – b are ₹30 Crores and 0.20 respectively, then the Saving Expenditure at income level ₹200 Crores will be
S = -30 + 0.20(200)
= – 30 + 40
₹10 Crores.
Leave a Reply