What is Supply Schedule?
In economics, a Supply schedule is defined as a tabular representation of the law of supply. It represents the quantities of a product supplied by a supplier at different prices and time periods, keeping all other factors constant.
Table of Content [Show]
Also Read: What is Supply?
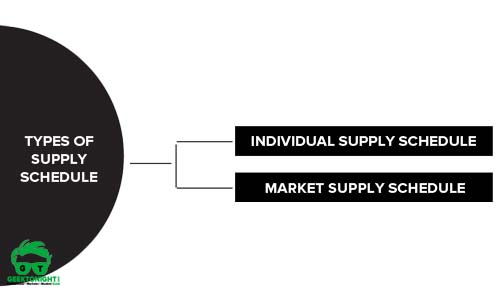
Types of Supply Schedule
There can be two types of supply schedules and those are explained below:

Individual Supply Schedule
Individual supply schedule: This schedule represents the quantities of a product supplied by an individual firm or supplier at different prices during a specific period of time, assuming other factors remain unchanged.
Example
Let us understand the individual supply schedule with the help of an example. Table shows the supply schedule of a firm supplying commodity A:
| PRICE OF THE PRODUCT (₹ PER KG) | QUANTITY SUPPLIED OF COMMODITY A (KG PER WEEK) |
|---|---|
| 5 | 3,000 |
| 10 | 8,000 |
| 15 | 12,000 |
| 20 | 15,000 |
From Table, it is clear that the firm is supplying 3,000 kg per week of commodity A at a price of 5 per kg. As the price rises from 5 to 10 per kg, the firm also increased the supply to 8,000 per kg. Therefore, the individual supply schedule shown in Table indicates that the quantity supplied increases with a rise in price.
Market supply schedule
Market supply schedule: This schedule represents the quantities of a product supplied by all firms or suppliers in the market at different prices during a specific period of time, while other factors are constant.
In other words, market supply schedule can be defined as the summation of all individual supply schedules. Table shows the market supply schedule of two firms X and Y for commodity A:
Example
| PRICE OF PRODUCT A (₹ PER KG) | QUANTITY SUPPLIED BY FIRM X (1000 KG PER WEEK) | QUANTITY SUPPLIED BY FIRM Y (1000 KG PER WEEK) | MARKET SUPPLY (1000 KG PER WEEK) |
|---|---|---|---|
| 5 | 3 | 7 | 10 |
| 10 | 8 | 12 | 20 |
| 15 | 12 | 15 | 27 |
| 20 | 15 | 17 | 32 |
In Table 3.2, market supply is calculated by combining the quantities supplied by firm X and Y. It also shows when the commodity is priced at ₹5 per kg, the market supply of commodity A is 10,000 kg per week. When the price rises to ₹10 per kg, the market supply also increases to 20,000 per kg. So it can be observed, that a rise in price of the commodity A increases the market supply.
Leave a Reply