In many types of motion, the acceleration is either constant or approximately so. For example, you might accelerate a car at an approximately constant rate when a traffic light turns from red to green. Then graphs of your position, velocity, and acceleration would resemble those in Fig. 2-8. (Note that a(t) in Fig. 2-8c is constant, which requires that ν(t) in Fig. 2-8b have a constant slope.) Later when you brake the car to a stop, the acceleration (or deceleration in common language) might also be approximately constant.
Such cases are so common that a special set of equations has been derived for dealing with them. One approach to the derivation of these equations is given in this section. A second approach is given in the next section. Throughout both sections and later when you work on the homework problems, keep in mind that these equations are valid only for constant acceleration (or situations in which you can approximate the acceleration as being constant).
When the acceleration is constant, the average acceleration and instantaneous acceleration are equal and we can write Eq. 2-7, with some changes in notation, as

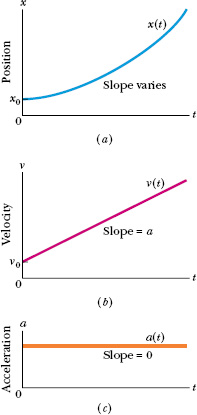
Fig. 2-8 (a) The position x(t) of a particle moving with constant acceleration. (b) Its velocity ν(t), given at each point by the slope of the curve of x(t). (c) Its (constant) acceleration, equal to the (constant) slope of the curve of ν(t).
Here ν0 is the velocity at time t = 0 and ν is the velocity at any later time t. We can recast this equation as

As a check, note that this equation reduces to ν = ν0 for t = 0, as it must. As a further check, take the derivative of Eq. 2-11. Doing so yields dv/dt = a, which is the definition of a. Figure 2-8b shows a plot of Eq. 2-11, the ν(t) function; the function is linear and thus the plot is a straight line.
In a similar manner, we can rewrite Eq. 2-2 (with a few changes in notation) as

and then as

in which x0 is the position of the particle at t = 0 and νavg is the average velocity between t = 0 and a later time t.
For the linear velocity function in Eq. 2-11, the average velocity over any time interval (say, from t = 0 to a later time t) is the average of the velocity at the beginning of the interval (= ν0) and the velocity at the end of the interval (= ν). For the interval from t = 0 to the later time t then, the average velocity is

Substituting the right side of Eq. 2-11 for ν yields, after a little rearrangement,

Finally, substituting Eq. 2-14 into Eq. 2-12 yields

As a check, note that putting t = 0 yields x = x0, as it must. As a further check, taking the derivative of Eq. 2-15 yields Eq. 2-11, again as it must. Figure 2-8a shows a plot of Eq. 2-15; the function is quadratic and thus the plot is curved.
Equations 2-11 and 2-15 are the basic equations for constant acceleration; they can be used to solve any constant acceleration problem in this book. However, we can derive other equations that might prove useful in certain specific situations. First, note that as many as five quantities can possibly be involved in any problem about constant acceleration—namely, x − x0, ν, t, a, and ν0. Usually, one of these quantities is not involved in the problem, either as a given or as an unknown. We are then presented with three of the remaining quantities and asked to find the fourth.
Equations 2-11 and 2-15 each contain four of these quantities, but not the same four. In Eq. 2-11, the “missing ingredient” is the displacement x − x0. In Eq. 2-15, it is the velocity ν. These two equations can also be combined in three ways to yield three additional equations, each of which involves a different “missing variable.” First, we can eliminate t to obtain

This equation is useful if we do not know t and are not required to find it. Second, we can eliminate the acceleration a between Eqs. 2-11 and 2-15 to produce an equation in which a does not appear:

Finally, we can eliminate ν0, obtaining

Note the subtle difference between this equation and Eq. 2-15. One involves the initial velocity ν0; the other involves the velocity ν at time t.
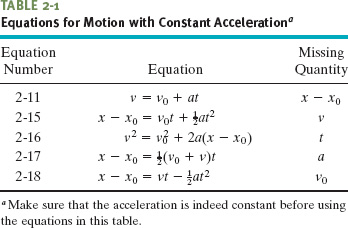
Table 2-1 lists the basic constant acceleration equations (Eqs. 2-11 and 2-15) as well as the specialized equations that we have derived. To solve a simple constant acceleration problem, you can usually use an equation from this list (if you have the list with you). Choose an equation for which the only unknown variable is the variable requested in the problem. A simpler plan is to remember only Eqs. 2-11 and 2-15, and then solve them as simultaneous equations whenever needed. An example is given in Sample Problem 2-5.
![]() CHECKPOINT 5 The following equations give the position x(t) of a particle in four situations: (1) x = 3t − 4; (2) x = −5t3 + 4t2 + 6; (3) x = 2/t2 − 4/t; (4) x = 5t2 − 3. To which of these situations do the equations of Table 2-1 apply?
CHECKPOINT 5 The following equations give the position x(t) of a particle in four situations: (1) x = 3t − 4; (2) x = −5t3 + 4t2 + 6; (3) x = 2/t2 − 4/t; (4) x = 5t2 − 3. To which of these situations do the equations of Table 2-1 apply?
Spotting a police car, you brake a Porsche from a speed of 100 km/h to a speed of 80.0 km/h during a displacement of 88.0 m, at a constant acceleration.
(a) What is that acceleration?
Solution: Assume that the motion is along the positive direction of an x axis. For simplicity, let us take the beginning of the braking to be at time t = 0, at position x0. The Key Idea here is that, with the acceleration constant, we can relate the car’s acceleration to its velocity and displacement via the basic constant acceleration equations (Eqs. 2-11 and 2-15). The initial velocity is ν0 = 100 km/h = 27.78 m/s, the displacement is x − x0 = 88.0 m, and the velocity at the end of that displacement is ν = 80.0 km/h = 22.22 m/s. However, we do not know the acceleration a and time t, which appear in both basic equations. So, we must solve those equations simultaneously.
To eliminate the unknown t, we use Eq. 2-11 to write

and then we substitute this expression into Eq. 2-15 to write

Solving for a and substituting known data then yield

Note that we could have used Eq. 2-16 instead to solve for a because the unknown t is the missing variable in that equation.
(b) How much time is required for the given decrease in speed?
Solution: Now that we know a, we can use Eq. 2-19 to solve for t:

If you are initially speeding and then try to slow to the speed limit, there is plenty of time for the police officer to measure your speed.
PROBLEM – SOLVING TACTICS
TACTIC 6 : Check the Dimensions
The dimension of a velocity is L/T—that is, length L divided by time T—and the dimension of an acceleration is L/T2. In any equation, the dimensions of all terms must be the same. If you are in doubt about an equation, check its dimensions.
To check the dimensions of Eq. 2-15 (x − x0 = ν0t + ![]() at2), note that every term must be a length, because that is the dimension of x and of x0. The dimension of the term ν0t is (L/T)(T), which is L. The dimension of
at2), note that every term must be a length, because that is the dimension of x and of x0. The dimension of the term ν0t is (L/T)(T), which is L. The dimension of ![]() at2 is (L/T2)(T2), which is also L. Thus, this equation checks out.
at2 is (L/T2)(T2), which is also L. Thus, this equation checks out.
2-8 Another Look at Constant Acceleration*
The first two equations in Table 2-1 are the basic equations from which the others are derived. Those two can be obtained by integration of the acceleration with the condition that a is constant. To find Eq. 2-11, we rewrite the definition of acceleration (Eq. 2-8) as

We next write the indefinite integral (or antiderivative) of both sides:

Since acceleration a is a constant, it can be taken outside the integration. Then we obtain

or

To evaluate the constant of integration C, we let t = 0, at which time ν = ν0. Substituting these values into Eq. 2-20 (which must hold for all values of t, including t = 0) yields

Substituting this into Eq. 2-20 gives us Eq. 2-11.
To derive Eq. 2-15, we rewrite the definition of velocity (Eq. 2-4) as

and then take the indefinite integral of both sides to obtain

Generally ν is not constant, so we cannot move it outside the integration. However, we can substitute for ν with Eq. 2-11:

Since ν0 is a constant, as is the acceleration a, this can be rewritten as

Integration now yields

where C′ is another constant of integration. At time t = 0, we have x = x0. Substituting these values in Eq. 2-21 yields x0 = C′. Replacing C′ with x0 in Eq. 2-21 gives us Eq. 2-15.
2-9 Free-Fall Acceleration
If you tossed an object either up or down and could somehow eliminate the effects of air on its flight, you would find that the object accelerates downward at a certain constant rate. That rate is called the free-fall acceleration, and its magnitude is represented by g. The acceleration is independent of the object’s characteristics, such as mass, density, or shape; it is the same for all objects.
* This section is intended for students who have had integral calculus.
Two examples of free-fall acceleration are shown in Fig. 2-9, which is a series of stroboscopic photos of a feather and an apple. As these objects fall, they accelerate downward—both at the same rate g. Thus, their speeds increase at the same rate, and they fall together.
The value of g varies slightly with latitude and with elevation. At sea level in Earth’s midlatitudes the value is 9.8 m/s2(or 32 ft/s2), which is what you should use as an exact number for the problems in this book unless otherwise noted.
The equations of motion in Table 2-1 for constant acceleration also apply to free fall near Earth’s surface; that is, they apply to an object in vertical flight, either up or down, when the effects of the air can be neglected. However, note that for free fall: (1) The directions of motion are now along a vertical y axis instead of the x axis, with the positive direction of y upward. (This is important for later chapters when combined horizontal and vertical motions are examined.) (2) The free-fall acceleration is negative—that is, downward on the y axis, toward Earth’s center—and so it has the value −g in the equations.
![]() The free-fall acceleration near Earth’s surface is a = −g = −9.8 m/s2, and the magnitude of the acceleration is g = 9.8 m/s2. Do not substitute −9.8 m/s for g.
The free-fall acceleration near Earth’s surface is a = −g = −9.8 m/s2, and the magnitude of the acceleration is g = 9.8 m/s2. Do not substitute −9.8 m/s for g.
Suppose you toss a tomato directly upward with an initial (positive) velocity ν0 and then catch it when it returns to the release level. During its free-fall flight (from just after its release to just before it is caught), the equations of Table 2-1 apply to its motion. The acceleration is always a = −g = −9.8 m/s2, negative and thus downward. The velocity, however, changes, as indicated by Eqs. 2-11 and 2-16: during the ascent, the magnitude of the positive velocity decreases, until it momentarily becomes zero. Because the tomato has then stopped, it is at its maximum height. During the descent, the magnitude of the (now negative) velocity increases.

Fig. 2-9 A feather and an apple free fall in vacuum at the same magnitude of acceleration g. The acceleration increases the distance between successive images. In the absence of air, the feather and apple fall together.
On September 26, 1993, Dave Munday went over the Canadian edge of Niagara Falls in a steel ball equipped with an air hole and then fell 48 m to the water (and rocks). Assume his initial velocity was zero, and neglect the effect of the air on the ball during the fall.
(a) How long did Munday fall to reach the water surface?
Solution: The Key Idea here is that, because Munday’s fall was a free fall, the equations of Table 2-1 apply. Let us place a y axis along the path of his fall, with y = 0 at his starting point and the positive direction up the axis (Fig. 2-10). Then the acceleration is a = −g along that axis, and the water level is at y = −48 m (negative because it is below y = 0). Let the fall begin at time t = 0, with initial velocity ν0 = 0.
From Table 2-1 we choose Eq. 2-15 (but in y notation) because it contains the requested time t and all the other variables have known values. We find

Note that Munday’s displacement y − y0 is a negative quantity—Munday fell down, in the negative direction of the y axis (he did not fall up!). Also note that 48/4.9 has two square roots: 3.1 and −3.1. Here we choose the positive root because Munday obviously reaches the water surface after he begins to fall at t = 0.
(b) Munday could count off the three seconds of free fall but could not see how far he had fallen with each count. Determine his position at each full second.
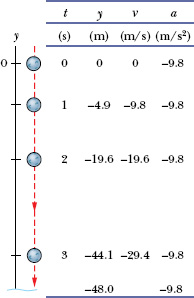
Fig. 2-10 The position, velocity, and acceleration of a freely falling object, here the steel ball ridden by Dave Munday over Niagara Falls.
Solution: We again use Eq. 2-15 but now we substitute, in turn, the values t = 1.0 s, 2.0 s, and 3.0 s, and solve for Munday’s position y. The results are shown in Fig. 2-10.
(c) What was Munday’s velocity as he reached the water surface?
Solution: To find the velocity from the original data without using the time of fall from (a), we rewrite Eq. 2-16 in y notation and then substitute known data:

We chose the negative root here because the velocity was in the negative direction.
(d) What was Munday’s velocity at each count of one full second? Was he aware of his increasing speed?
Solution: To find the velocities from the original data without using the positions from (b), we let a = −g in Eq. 2-11 and then substitute, in turn, the values t = 1.0 s, 2.0 s, and 3.0 s. Here is an example:

The other results are shown in Fig. 2-10.
Once he was in free fall, Munday was unaware of the increasing speed because the acceleration during the fall was always −9.8 m/s2, as noted in the last column of Fig. 2-10. He was, of course, sharply aware of hitting the water because then the acceleration abruptly changed. (Munday survived the fall but then faced stiff legal fines for his daredevil action.)
In Fig. 2-11, a pitcher tosses a baseball up along a y axis, with an initial speed of 12 m/s.
(a) How long does the ball take to reach its maximum height?
Solution: One Key Idea here is that once the ball leaves the pitcher and before it returns to his hand, its acceleration is the free-fall acceleration a = −g. Because this is constant, Table 2-1 applies to the motion. A second Key Idea is that the velocity ν at the maximum height must be 0. So, knowing ν, a, and the initial velocity ν0 = 12 m/s, and seeking t, we solve Eq. 2-11, which contains those four variables. This yields

(b) What is the ball’s maximum height above its release point?
Solution: We can take the ball’s release point to be y0 = 0. We can then write Eq. 2-16 in y notation, set y − y0 = y and ν = 0 (at the maximum height), and solve for y. We get

(c) How long does the ball take to reach a point 5.0 m above its release point?
Solution: We know ν0, a = −g, and displacement y − y0 = 5.0 m, and we want t, so we choose Eq. 2-15. Rewriting it for y and setting y0 = 0 give us

If we temporarily omit the units (having noted that they are consistent), we can rewrite this as

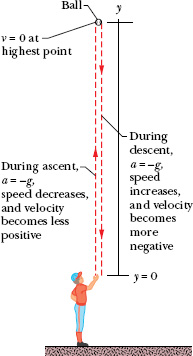
Fig. 2-11 A pitcher tosses a baseball straight up into the air. The equations of free fall apply for rising as well as for falling objects, provided any effects from the air can be neglected.
Solving this quadratic equation for t yields

There are two such times! This is not really surprising because the ball passes twice through y = 5.0 m, once on the way up and once on the way down.
![]() CHECKPOINT 6 (a) In this sample problem, what is the sign of the ball’s displacement for the ascent, from the release point to the highest point? (b) What is it for the descent, from the highest point back to the release point? (c) What is the ball’s acceleration at its highest point?
CHECKPOINT 6 (a) In this sample problem, what is the sign of the ball’s displacement for the ascent, from the release point to the highest point? (b) What is it for the descent, from the highest point back to the release point? (c) What is the ball’s acceleration at its highest point?
TACTIC 7 : Meanings of Minus Signs
In Sample Problems 2-6 and 2-7, we established a vertical axis (the y axis) and we chose—quite arbitrarily—its upward direction to be positive. We then chose the origin of the y axis (that is, the y = 0 position) to suit the problem. In Sample Problem 2-6, the origin was at the top of the falls, and in Sample Problem 2-7 it was at the pitcher’s hand. A negative value of y then means that the body is below the chosen origin. A negative velocity means that the body is moving in the negative direction of the y axis—that is, downward. This is true no matter where the body is located.
We take the acceleration to be negative (−9.8 m/s2) in all problems dealing with falling bodies. A negative acceleration means that, as time goes on, the velocity of the body becomes either less positive or more negative. This is true no matter where the body is located and no matter how fast or in what direction it is moving. In Sample Problem 2-7, the acceleration of the ball is negative (downward) throughout its flight, whether the ball is rising or falling.
TACTIC 8 : Unexpected Answers
Mathematics often generates answers that you might not have thought of as possibilities, as in Sample Problem 2-7c. If you get more answers than you expect, do not automatically discard the ones that do not seem to fit. Examine them carefully for physical meaning. If time is your variable, even a negative value can mean something; negative time simply refers to time before t = 0, the (arbitrary) time at which you decided to start your stopwatch.
2-10 Graphical Integration in Motion Analysis
When we have a graph of an object’s acceleration versus time, we can integrate on the graph to find the object’s velocity at any given time. Because acceleration a is defined in terms of velocity as a = dv/dt, the Fundamental Theorem of Calculus tells us that

The right side of the equation is a definite integral (it gives a numerical result rather than a function), ν0 is the velocity at time t0, and ν1 is the velocity at later time t1. The definite integral can be evaluated from an a(t) graph, such as in Fig. 2-12a. In particular,

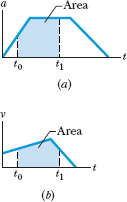
Fig. 2-12 The area between a plotted curve and the horizontal time axis, from time t to time t1, is indicated for (a) a graph of acceleration a versus t and (b) a graph of velocity ν versus t.
If a unit of acceleration is 1 m/s2 and a unit of time is 1 s, then the corresponding unit of area on the graph is

which is (properly) a unit of velocity. When the acceleration curve is above the time axis, the area is positive; when the curve is below the time axis, the area is negative.
Similarly, because velocity ν is defined in terms of the position x as ν = dx/dt, then

where x0 is the position at time t0 and x1 is the position at time t1. The definite integral on the right side of Eq. 2-24 can be evaluated from a ν(t) graph, like that shown in Fig. 2-12b. In particular,

If the unit of velocity is 1 m/s and the unit of time is 1 s, then the corresponding unit of area on the graph is
(1 m/s)(1 s) = 1 m,
which is (properly) a unit of position and displacement. Whether this area is positive or negative is determined as described for the a(t) curve of Fig. 2-12a.
In one test to study neck injury in rear-end collisions, a volunteer was strapped to a seat that was then moved abruptly to simulate a collision by a rear car moving at 10.5 km/h. Figure 2-13a gives the accelerations of the volunteer’s torso and head during the collision, which began at time t = 0. The torso acceleration was delayed by 40 ms because during that time interval the seat back had to compress against the volunteer. The head acceleration was delayed by an additional 70 ms. What was the torso speed when the head began to accelerate?
Solution: The Key Idea here is that we can calculate the torso speed at any time by finding an area on the torso a(t) graph. We know that the initial torso speed is ν0 = 0 at time t0 = 0, at the start of the “collision.” We want the torso speed ν1 at time t1 = 110 ms, which is when the head begins to accelerate.
Combining Eqs. 2-22 and 2-23, we can write

For convenience, let us separate the area into three regions (Fig. 2-13b). From 0 to 40 ms, region A has no area:
areaA = 0.
From 40 ms to 100 ms, region B has the shape of a triangle, with area

From 100 ms to 110 ms, region C has the shape of a rectangle, with area

Substituting these values and ν0 = 0 into Eq. 2-26 gives us

When the head is just starting to move forward, the torso already has a speed of 7.2 km/h. Researchers argue that it is this difference in speeds during the early stage of a rear-end collision that injures the neck. The backward whipping of the head happens later and could, especially if there is no head restraint, increase the injury.
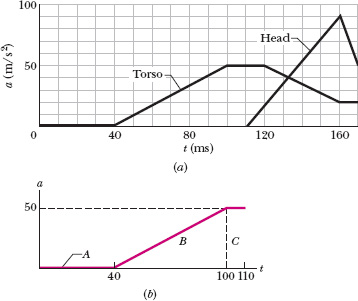
Fig. 2-13 (a) The a(t) curve of the torso and head of a volunteer in a simulation of a rear-end collision. (b) Breaking up the region between the plotted curve and the time axis to calculate the area.
Leave a Reply