Several types of phase behavior may occur in binary systems.1 In earlier chapters, we explored phase behavior by examining P-x-y or T-x-y diagrams. In this section we demonstrate how these phase diagrams are related to the three-dimensional P-T-x-y diagrams. The P-x-y and T-x-y diagrams are two-dimensional cross sections of the three-dimensional phase envelope, and by studying the phase envelope, the progressions of changing shapes of the two-dimensional cross sections can be more easily grasped. The relations between the three-dimensional phase envelope and the cross sections are shown in Figs. 16.1A–16.1C for three different systems that all fall under the classification as Type I systems. Type I is the simplest class of phase behavior because there is no LLE behavior. Note that nonazeotrope as well as minimum boiling and maximum boiling homogeneous azeotropes are in this class. In each of the three-dimensional diagrams, short dashes are used to denote the pure component vapor pressures which terminate at the critical points denoted by A and B. Horizontal cross sections of the three-dimensional phase envelopes are shown with long dashes and are T-x-y diagrams. Vertical cross sections of the three-dimensional phase envelopes are shown with solid lines, and are P-x-y diagrams. (A summary of special notation used in this section appears at the end of the section.) There is a one-to-one correspondence of the cross sections in the three-dimensional plots to the phase envelopes plotted on the P-x-y and T-x-y cross sections. The solid line running from the critical point of A to the critical point of B is the locus of critical points of the mixture where the vapor and liquid become identical. Note the branches of the two-dimensional cross sections do not span the composition range when the critical locus is intersected. Each lobe on the cross sections will have a critical point. As discussed in Example 15.10 on page 601, the critical points are frequently not at the maximum temperature or pressure of the phase envelope. Refer back to phase diagrams from Chapters 10–15 to see how the phase diagrams in those chapters relate to the diagrams shown here.
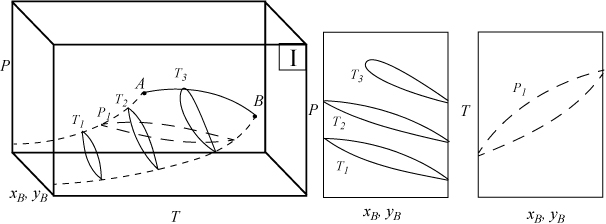
Figure 16.1A. Illustration of a system which does not form an azeotrope. The two-dimensional envelopes correspond to cross sections shown on the three-dimensional diagram. The P-x-y diagrams are vertical cross sections, and the T-x-y is a horizontal cross section.
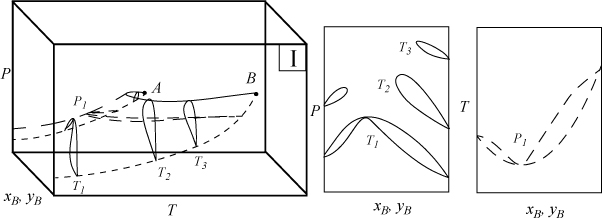
Figure 16.1B. Illustration of a system which forms a minimum boiling azeotrope due to positive deviations from Raoult’s law. The two-dimensional envelopes correspond to cross sections shown on the three-dimensional diagram.
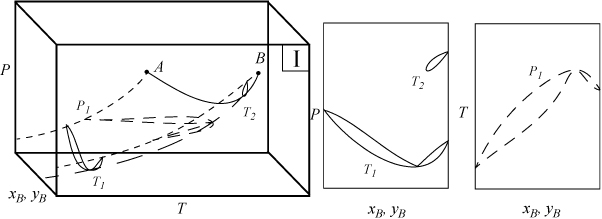
Figure 16.1C. Illustration of a system which forms a maximum boiling azeotrope due to negative deviations from Raoult’s law. The two-dimensional envelopes correspond to cross sections shown on the three-dimensional diagram.
![]() A summary of special notation appears at the end of this section.
A summary of special notation appears at the end of this section.
![]() P-x-y and T-x-y diagrams are cross sections of 3D phase envelopes.
P-x-y and T-x-y diagrams are cross sections of 3D phase envelopes.
P-x-y and T-x-y diagrams for systems with LLE are shown in Figs. 16.2A and 16.2B. The liquid-liquid behavior occurs in the region to the left of the critical endpoint U, in the U-shaped region above the vapor-liquid envelope. Three-phase llv occurs on the surface marked with tie lines. The intersection of this surface with P-x-y and T-x-y diagrams results in the llv tie lines on the cross-section diagrams. At the upper critical endpoint, U, a vapor and liquid phase become identical, denoted with the notation l–l=v. When the vapor pressures of the components are significantly different from each other, the system may not have an azeotrope as shown in Fig. 16.2A(a–c). When the vapor pressures are closer to each other, azeotropes and heteroazeotropes will form. Fig. 16.2B(d–f) shows a system with heteroazeotropic behavior below the temperature of the upper critical endpoint, TU, and azeotropic behavior above TU.
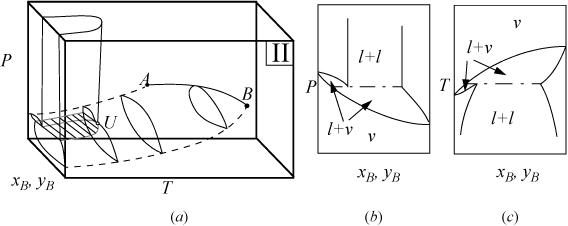
Figure 16.2A. (a) Type II system where the vapor pressures are significantly different; (b) P-x-y at a temperature below TU; (c) T-x-y at a pressure below PU.
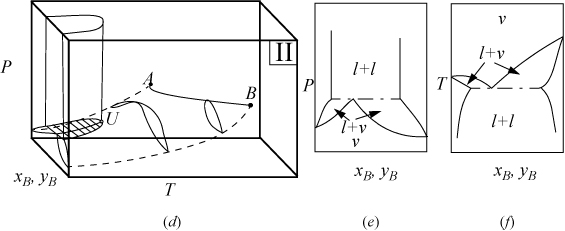
Figure 16.2B. (d) Type II system where the vapor pressures are relatively similar; (e) P-x-y at a temperature below TU; (f) T-x-y at a pressure below PU. It is also possible for an azeotrope to lie to the right or left of the liquid-liquid region, rather than the heteroazeotropic behavior that is shown.
Perspective
Before advancing further into the phase behavior classifications, some justification for such study is offered. High pressure can be used to create dense fluids that are useful for processing. For example, high pressure gases are employed industrially for petroleum fractionations in the oil industry and for hops and spice extractions and coffee decaffeination in the food industry. Dense gases are also under study for fractionation of specialty vegetable and fish oil components, as reaction media for polymerizations and other chemical synthesis and separations. High pressure processing and supercritical fluid extraction rely on control of solubility through manipulation of temperature and pressure. Solubility behaviors follow clear patterns which depend on similarities/differences in the thermodynamic and structural properties of the solute and the solvent. This section serves as an overview of phase behavior and systematic trends in phase behavior.
Natural materials such as foods and oils are multicomponent mixtures. Polymers typically contain a molecular weight distribution. Frequently, these types of mixtures are not well identified or characterized. Solubilities and extractabilities for these mixtures are currently difficult to predict quantitatively; however, significant knowledge regarding solubility trends may be obtained by studying simpler binary and ternary systems. Solubility represents a saturation condition; therefore, solubility is represented as a boundary on a phase diagram. Systematic study of binary and ternary systems shows that the phase boundaries of ternary systems are intermediate to the constituent binary systems, and many of the same trends continue in multicomponent systems,2 although fundamental exploration of the trends is an ongoing research topic. Process simulators and computers continue to simplify the calculation of phase equilibria; however, the interpretation of the resultant phase behavior is aided by a general understanding of the classes of phase behavior presented in this section.
Leave a Reply