The Scatchard-Hildebrand theory provides reasonable results for hydrocarbon mixtures, but the results can be highly unreliable if one of the components hydrogen bonds, especially if one of the components is water. The MOSCED, SSCED, and HSP models remedy this problem by accounting for hydrogen bonding as a separate contribution to the solubility parameter. MOSCED (pronounced moss-ked) stands for MOdified Separation of Cohesive Energy Density. SSCED (pronounced sked) stands for Simplified Separation of Cohesive Energy Density. Recall that the cohesive energy density is the term for δ2. The HSP model (Hansen Solubility Parameters) is similar in concept, but does not distinguish between acidity and basicity.8 Therefore, it cannot predict negative deviations from ideality in the manner of MOSCED or SSCED and is omitted from detailed discussion. It has been broadly applied, however, and provides impressive demonstrations of what can be achieved with these kinds of theories. The concept behind these models is that hydrogen bonding should be counted separately from the physical interactions envisioned by Scatchard and Hildebrand.
The MOSCED Model
The MOSCED model is given by,9


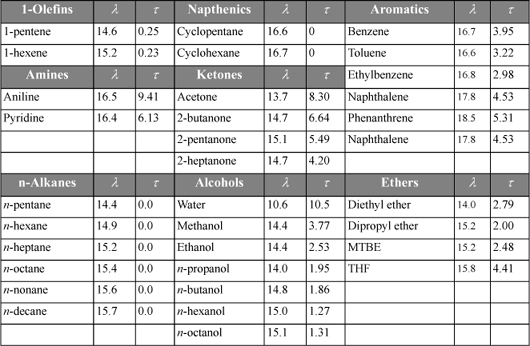
where λi is the dispersion factor (e.g., equal to δ for n-alkanes), τi is the polarity factor (e.g., 3.95 for benzene), qi is a factor ranging from 0.9 to 1 (for our purposes, qi = 1 for all i, cf. reference 9 for details) and α and β are acidity and basicity parameters. Values of λ and τ are given in Table 12.2. Values of α and β are given on the back flap. We recognize d12 as the Flory-Huggins contribution. aa, ψ1 and ξ1 are parameters characterizing solvent properties.


Table 12.2. Dispersion (λ) and Polarity (τ) Parameters in (J/cm3)1/2 liquids at 293 K

Note that MOSCED is not intended to describe the entire solution behavior directly. Instead, it provides estimates for the infinite dilution activity coefficients. At that point, another activity coefficient model can be applied by fitting its parameters at infinite dilution to the MOSCED predictions.
The essential feature of this model is the explicit representation of acidity and basicity. Consider, for example, the acetone + chloroform system of Fig. 9.6(c). MOSCED model predicts a negative deviation from ideality for this system, as is the experimental behavior:

For 2-propanol + water, a positive deviation is properly indicated:

These measures of acidity and basicity provide useful insights into the chemical nature of compounds. It is notable that they can be characterized spectroscopically by mixing a range of compounds with standard bases and acids. To measure acidity, for example, one might individually mix pyridine with acetone, benzene, chloroform, and acetic acid. More acidic molecules would bind more strongly to the pyridine nitrogen and shift the ultraviolet absorption more strongly. So the magnitude of the shift would provide a relative measure of the acidity.10 By verifying the trend with other standard bases, an average indicator could be developed for the acidity of each compound (and its variance). The spectroscopic measurement is independent from the VLE measurement, so the two observations strongly reinforce each other. This kind of chemical insight combined with spectroscopic evidence can be useful in a wide variety of settings. In catalyst design, for example, one might devise acidic adsorption sites to attract a reactant with high basicity, then measure spectroscopically whether the device was working. Students should look for creative opportunities to relate concepts like these across the curriculum.
The SSCED Model
Despite its attractions, the MOSCED model is relatively cumbersome. It has many terms, and in the end, another model (e.g., Redlich-Kister, van Laar, or a model from the next chapter) must be used to compute the phase behavior. As an pedagogical introduction to MOSCED, we would like to estimate the phase behavior with sufficient accuracy to predict whether an azeotrope or liquid-liquid separation may occur, but to make only approximate estimates with a single self-consistent theory. These motivations suggest a need for a simplified version of MOSCED.
Similar to MOSCED, the SSCED model retains the simple form of the Scatchard-Hildebrand model while correcting its gross misrepresentation of polar mixtures by taking advantage of the acidity and basicity measures of MOSCED. For a binary mixture, the SSCED model is


Example 12.6. Predicting VLE with the SSCED model
Amines often function as bases that can moderate interactions with acidic compounds. In the case of triethylamine, however, the high hydrocarbon content competes with the basicity and it is difficult to intuitively assess how the solution ideality may turn out.
a. Predict the bubble pressure and vapor composition of triethylamine (1) + ethanol (2) at 308 K and x1 = 0.59 using the SSCED model.
b. Compute the relative volatility, αLH, at x1 = 0.01 and 0.99, where triethylamine is the light key component. Is an azeotrope indicated? Copp and Everett (1953) report an azeotrope at x1 = 0.59 and P = 119 mmHg.
SSCED and Antoine constants for triethylamine are:

Solution
a. From the Antoine equation, P1sat = 109; P2sat = 102 mmHg (cf. Appendix E for ethanol);
δ1′ = 15.17 – 0 = 15.17; δ2′ = (26.132 – 2·12.58·13.29)½ = 18.67; V1= 101/0.72= 140; V2=58.5.
From Eqn. 12.51, k12 = (12.58 – 0)(13.29 – 7.70)/(4·15.17·18.67) = 0.062;
[(δ2′ – δ1′)2 + 2k12δ1′δ2′]/RT = [(18.67 – 15.17)2 + 2·0.062·18.67·15.17]/(8.314·308) = 0.0185.
At x1 = 0.59, Φ1 = 0.59·140/(0.59·140 + 0.41·58.5) = 0.774.
γ1 = exp(140(1 – 0.774)20.0185) = 1.141; γ2 = exp(58.5(0.774)20.0185) = 1.916;
P = 0.59·1.141·109 + 0.41·1.01·102 = 154; y1 = 0.59·1.141·109/154 = 0.477.
b. At x1 = 0.01, Φ1 = 0.01·140/(0.01·140+0.99·58.5) = 0.024;
γ1 = exp(140(1 – 0.024)20.0185) = 11.9; γ2 = exp(58.5(0.024)20.0185) = 1.001;
P = 0.01·11.9·109 + 0.41·1.001·102 = 114; y1 = 0.99·1.001·109/114 = 0.113.
αLH(0.01) = 11.9·109/(1.001·102) = 12.6
At x1 = 0.99, Φ1 = 0.99·140/(0.99·140 + 0.01·58.5) = 0.996;
γ1 = exp(140(1 – 0.996)20.0185) = 1.0001; γ2 = exp(58.5(0.996)20.0185) = 2.93;
P = 0.99·1.0001·109 + 0.01·2.93·102 = 111; y1 = 0.99·1.0001·109/111 = 0.973.
αLH(0.99) = 1.0001·109/(2.93·102) = 0.363
Therefore, an azeotrope is suspected since αLH – 1 changes sign as discussed in Section 11.11. The system should be evaluated experimentally or with a literature search.
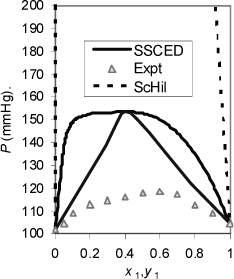
To follow up, Fig. 12.3 shows through comparison to experiment that the SSCED model overestimates the nonideality of the solution, but the prediction of an azeotrope is valid. For a broader perspective, we can go beyond Example 12.6 and compare to the Scatchard-Hildebrand model, but the Scatchard-Hildebrand (ScHil) model is not even close. In fact, the Scatchard-Hildebrand model indicates VLLE where none exists. This is a common problem with Scatchard-Hildebrand theory in the presence of hydrogen bonding. It undermines the viability of the Scatchard-Hildebrand model for most applications, but the SSCED model retains its simplicity while providing a reasonable basis for conceiving formulations predictively. As a final note, the MAB model performs slightly better than the SSCED model for this mixture with P = 148 mmHg.

Figure 12.3. VLE of triethylamine(1)+ethanol at 308 K. The basicity of the amine moderates the non-ideality of the solution by solvating the hydroxyl interaction. Data of Copp J.L., Everett D.H. 1953. Disc. Faraday Soc.15:174.
12.6. Molecular Perspective and VLE Predictions
Can we just forget about some of these models? After all, the van der Waals perspective inherently accounts for the molecular properties through a and b. Why should we worry with so many variations? Is the SSCED model really so different from the Scatchard-Hildebrand model? What about the MAB model? The van Laar model? Which model is “best?” In every case, there is a factor mitigating against entirely eliminating any one of the models from consideration.
To begin, it is possible to derive the MAB model as a special case of the SSCED model. When V1 = V2 and δ1′ = δ2′, we obtain Φi = xi, and we obtain the Margules one-parameter model,

Technically, we could simply substitute V1 or V2 instead of (V1 + V2)/2, but writing it this way provides a small compensation for the observation that it is extremely unlikely that V1 = V2. So, if the MAB model is such an oversimplification, why not forget about it and just use the SSCED model? That would be a good argument, except that MAB is such a simple model. It does not require converting from mole fraction to volume fraction and you can anticipate the predicted sign on GE without using a calculator.
On the other hand, the Δδ′ term of SSCED is quite significant in some cases. For example, n-hexane + methylethylketone has a significant non-ideality that is overlooked by MAB. A similar argument could be made about polyethylene + polypropylene. Furthermore, the distinction between V1 and V2 in SSCED correctly indicates that it is much less favorable to squeeze a large molecule into a fluid of small molecules than vice versa, as in the n-butanol + water system.
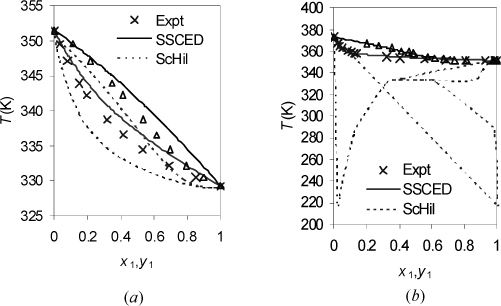
Another argument could be made about the difference between the SSCED and Scatchard-Hildebrand models. Both models have the same skewness when k12 is fit to experimental data. The Scatchard-Hildebrand model takes precedence historically. So maybe we should forget the SSCED model. On the other hand, SSCED provides better a priori predictions of phase behavior when an associating component is involved. Eqn. 12.50 shows that the solubility parameter is unaltered if α = 0 or β = 0, but it is substantially diminished for associating compounds like alcohols and water. With this change alone, the estimated nonideality is substantially diminished. This is a step in the right direction because overestimating the nonideality (Scatchard-Hildebrand) may cause more confusion than treating the solution as ideal (Fig. 12.4(a)). Remember to “First, do no harm.” A similar observation is illustrated in Fig. 12.4(b). The peculiar lines of the Scatchard-Hildebrand (ScHil) model show what happens if a VLE model is applied when the activity model indicates VLLE. The experimental data indicate no LLE for either system, showing the qualitative deficiency of the Scatchard-Hildebrand model for associating mixtures, as well as its quantitative deficiency. The SSCED model, on the other hand, is qualitatively correct, and semi-quantitative in its predictions.

Figure 12.4. Predictions of SSCED and Scatchard-Hildebrand theories at 1 bar. For Scatchard-Hildebrand theory, kij = 0 is applied. For SSCED, Eqn. 12.51 applies. (a) Acetone+ethanol (data of Amer, H.H., Paxton, R.R. van Winkle, M. 1956. I&EC, 48:142); (b) ethanol+water (data of Bloom, C.H., Clump, C.W., Koeckert, A.H. 1961. Ind. Eng. Chem. 53:829).
Another distinction between SSCED and the Scatchard-Hildebrand model is the guideline for k12 given by Eqn. 12.51. We can compute the VLE with this guideline and compare to the VLE at k12 = 0 to get a range of estimates that suggests the direction of the nonideality and its magnitude. Having multiple VLE estimates may seem like a bad idea, but computing a single crude prediction ignoring alternative estimates would be a much worse idea. Contradictory estimates should remind us of the value of using experimental data to correlate k12 whenever possible. The procedure for correlating k12 of SSCED based on experimental data is not different from the procedure for the Scatchard-Hildebrand model, nor from the procedure for the Margules or van Laar models.
One could also argue that the van Laar model provides the best fit of the VLE data, so it should be preferred. On the other hand, it offers no predictive capability, and we really would like to conceive designs for formulations. Furthermore, the van Laar model cannot be extended to multicomponent mixtures in a manner that is consistent with the van der Waals perspective, as discussed in the next section.
Finally, one might consider the MOSCED model to be the best model. First, it includes the Flory-Huggins correction for polymer-solvent interactions. Second, when combined with the van Laar or two-parameter Margules model, it provides predictive capability that is superior to the SSCED model. In a particular case study involving organic nitrates, the SSCED model gave roughly 10% deviation in predicted bubble pressure while the MOSCED model gave only 5%. Furthermore, the predictive insight of MOSCED is at least as good as that of SSCED because it uses the same values of α, β, δ, and V. On the other hand, it requires several more intermediate calculations than the SSCED model, including the translation of the infinite dilution activity coefficients into a different activity model and subsequent computation of the activity coefficient at the concentration of interest. The requirement of so many intermediate computations generally necessitates the use of a computer, in which case the methods of Chapter 13 are generally preferred. Overall, the argument in favor of MOSCED over SSCED is probably the best, however.
In summary, the “best” overall activity model should account for simple molecular properties in addition to providing a basis for fitting the data of a specific binary system, because our overall goal includes conceiving of formulations. Formulations generally involve more than two components and designing them requires simple intuitive insights like energy density (reflected in δi’) and hydrogen bonding (reflected in α and β). A small molecule with a high energy density disfavors molecules with less energy density just as an associating compound squeezes out an inert one. The interplay between these types of molecular interactions is significant and it is best to contemplate both influences when predicting phase behavior. Through the SSCED model, several observations can be cited about this interplay: (1) Ignoring hydrogen bonding leads to overestimates of solution nonideality, as observed for the Scatchard-Hildebrand model; (2) accounting for hydrogen bonding reduces the differences in disperse interactions (i.e. Δδi′ < Δδi); (3) competition between the effects of complexation and energy density can make it difficult to predict whether deviations from Raoult’s law are positive or negative; and (4) large nonidealities result when both association and energy density indicate unfavorable mixing, typified by the hydrophobic effect.
In this context the SSCED and MOSCED models would appear to provide the best overall models within the van der Waals perspective because they both account for the interplay between energy density and hydrogen bonding. The trade-off between them is one of precision versus simplicity. Resolving this trade-off requires the context of a particular application. If you are always working with similar solvents and species, the greater detail of the MOSCED model may provide opportunities for refining your predictions.
Leave a Reply