We introduced some major points about the importance of distillation in Section 3.2. Roughly 80% of separations are done involving distillation and 70% of the capital cost of a chemical plant goes into distillation equipment, and thus the proper application of vapor-liquid equilibria and design are essential. Usually, one distillation column is required to separate any two components. To separate three components to high purity requires two columns. Obtaining four components to high purity requires three columns, and so forth. So a single reactor that requires two reactants and produces two products (A + B → C + D) would probably require three distillation columns downstream if all the components are desired in high purity. Pharmaceutical and speciality chemical plants have more by-products than bulk chemical plants. This means that chemical engineers need to be fairly familiar with VLE, especially in the fine chemicals industry.
How Distillation Works
How does the laboratory experiment (Fig. 10.6(a)) relate to distillation in a chemical plant (Fig. 10.6(b) and (c))? We begin with an elementary introduction to the conceptual basis of distillation. We then follow up with more detailed descriptions of the basis for modeling the process.
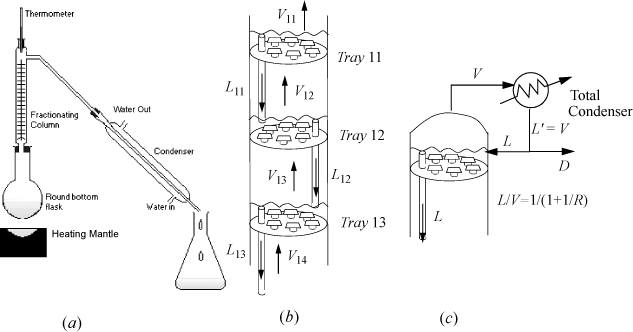
Figure 10.6. Schematic diagrams of distillation columns. (a) A typical chemistry laboratory distillation apparatus; (b) close-up view of sieve trays showing the holes in the trays, downcomers, and liquid on each tray; (c) a partial condenser operates like a flash unit.
Thermodynamics teaches us that the most volatile components are enriched in the vapor phase when a liquid solution is boiled. For example, suppose that you want to recover methanol (a potential transportation fuel or reactant for a fuel cell) from a mixture of 10% methanol (MeOH) and 90% water. The thermodynamics of the methanol + water system are summarized in Fig. 10.7. Fig. 10.7(a) shows that the solution bubble-point temperature is ~87°C. As it boils, the temperature remains constant, but the vapor composition leaving the vessel is ~40 mol% MeOH. Let us call this separation stage a. Forty percent is a big improvement over the initial 10%, but it is still mostly water. What can you do to make it more pure? Why not condense the vapor to a liquid and collect it in a separate pot to reboil it? After you have enough solution in that pot, take it to another boiler and perform stage b, then repeat for stages c, d, e as shown in Fig. 10.7(a). After ~5 stages, you could obtain 98% pure methanol. This is a simplification of multistage distillation at the conceptual level. (Note that most process simulation software numbers stages from the column top which is why we designated stages as letters rather than numbering from the bottom.) As outlined so far, it is inefficient and oversimplified because we considered the liquid phase composition to be invariant while the volatile component was boiling off. Separation textbooks provide the details on the mass balances.
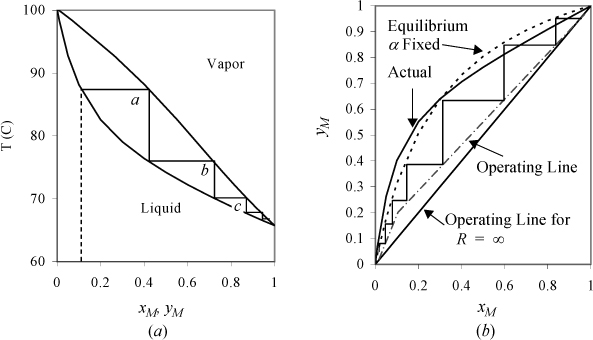
Figure 10.7. Stage-wise separation of methanol (M) and water. (a) T-x,y diagram at 1 bar, showing stages. (b) McCabe-Thiele analysis based on assuming constant relative volatility, αLH = [(αLHT)(αLHB)]½ (dotted line) compared with experimental curve.
The first law of thermodynamics tells us that energy is conserved. What if we could use the heat of condensing the vapor from stage a as the heat of boiling in stage b? That would be a big improvement. Furthermore, we can achieve this in minimal space if we use some clever plumbing. If we put the pot for stage b on top of stage a, and put little holes in the bottom of the pot, then the vapor boils through the holes faster than the liquid can weep back (Fig. 10.6(b)). The boiling point of the mixture on stage b is lower than the vapor temperature coming from below (cf. Fig. 10.7(a)). When the warmer vapor from stage a contacts the cooler liquid on stage b, it condenses. But the first law tells us that the heat of condensation must go somewhere. Where? It goes into boiling the liquid on stage b. Then we can do the same thing for stages c, d, e. This approach is called a tray distillation column and it is very common throughout the chemical industry. Roughly 70% of distillation columns are tray type.
We still have not addressed how tray distillation relates to the chemistry lab. The chemistry lab requires some gauze or glass wool in the glass tube above the boiling flask. Because of heat loss through the condenser walls, some of the boiling liquid condenses, then trickles down the gauze and falls back into the boiling flask. This trickling liquid serves the same function as the liquid on the trays, but of course the contact and mass exchange is much less efficient. On the other hand, we can generate a lot of surface area and a lot of vapor-liquid contact by using a lot of gauze. In the chemical industry, columns based on this principle are called packed columns. Packed columns comprise the other 30% of distillation columns. There is another big difference between the chemical industry and chemistry lab. The vast majority of industrial columns run in continuous steady-state mode, not batch mode like the chemistry lab. This means that continuous feed enters on a stage that has a similar composition to the feed.
Most mixtures contain more than two components. It is common, however, to design the multicomponent column based on the separation of two key components. Because boiling point (in the absence of azeotropes discussed later) increases with Mw, it is common to discuss separation based on light components (more volatile) moving up the column, and heavy components moving down. For preliminary column design a volatile light key (typically low Mw, thus light) and less volatile heavy key component are designated. Splitting two key components implicitly splits components lighter than the “light key” component from components heavier than the “heavy key” component. The split (S) is the fraction that exits with distillate. The light key (LK) component is the least volatile component with a split SLK > 0.5. System components lighter than the light key must be even more volatile and exit as distillate. For example, consider a distillation of hexane, octane, decane, and dodecane. If we designate octane as the light key, then the of hexane should also go out the top. The heavy key is the lightest component (most volatile) with a split SHK < 0.5. In the example, we could select decane as the heavy key and thus dodecane would go out the bottom also. In a perfect world, the splits would be 100% for the light key and 0% for the heavy key, but that would require an infinitely tall distillation column. More typical splits are 99% and 1%.
![]() Light key and heavy key components are used in preliminary column design.
Light key and heavy key components are used in preliminary column design.
The split fractions define the relevant mass balances in distillation. The thermodynamics relevant to distillation is implemented using the relative volatility in terms of the VLE K-ratios,

For the case of light and heavy key components,

For Raoult’s law, the K-ratios are independent of composition, and thus is the relative volatility,

For systems that don’t follow Raoult’s law, the relative volatility may vary through the column owing to composition changes, but distillation is feasible as long as αLH > 1. (We will show the analysis for the nonideal αij calculation in Section 11.11 on page 442.) The presence of other components is of secondary concern for preliminary column design as long as αLH > 1, so shortcut column analysis treats LK and HK as if the mixture were binary. It may be possible to improve αLH through the addition of other components (e.g., extractive distillation), but that merely reinforces the requirement of the overall system to the mandate that αLH > 1.
For the sake of modeling, the tray column is simplest to introduce as illustrated in Fig. 10.7(b). Fig. 10.7(b) focuses on the composition changes only, neglecting the temperature effects. Fig. 10.7(b) also shows the result of approximating that the relative volatility is constant. A larger αij results in a larger area under the x-y curve and an easier separation. If αij = 1, the curve collapses on the 45° diagonal. The diagram shows “steps” between the equilibrium line and the operating line. The equilibrium line represents the compositions at each tray as they leave. The operating line represents the compositions between trays. Moving up and down the column, the material balances are shown graphically by stepping back and forth as we relate the material balance “on stage” and “in-between stage.” Comparing the curves for actual and constant αij, note that a similar number of stages is obtained. For the purposes of our model, constant relative volatility is a convenient approximation for the equilibrium curve as shown. But there is still a significant detail that has been omitted in our conceptual outline of distillation. Where did the liquid come from that is on the trays of the tray column?
Fig. 10.6(c) shows how the condenser on top of the column pours liquid back down to keep some on the trays. The part that we pour back down the column (L) is called reflux. The part that we recover as product is called distillate (D). The ratio of L/D is called the reflux ratio (R). The reflux ratio controls the amount of product recovered as distillate. If we actually want to recover some product (i.e., D ≠ 0), then we must accept some value R ≠ ∞. Finite values for R lead to the dashed-dot operating lines in Fig. 10.7(b). To understand this, consider that the 45° diagonal on Fig. 10.7(b) corresponds to L/V = 1. It turns out that taking distillate from the top of the column leads to slightly less separation on every stage, giving the dashed-dot lines of Fig. 10.7(b). Typical courses in mass transfer operations explain how to estimate the dashed-dot lines from values of R. The key point for now is that the value of R cannot be zero, or we will have no liquid on the trays, and it cannot be infinite or we will recover no product. We can go a little further and say that it must be closer to infinity for a distillation that has a relative volatility very near to unity, because the y-x curve in that case stays very close to the diagonal. Beyond that, we simply need to accept that somebody has analyzed this before and developed some equations for computing the minimum number of stages to achieve a desired separation (at infinite reflux), the minimum reflux ratio, and the actual number of stages. This is indeed the case, and the model equations are presented below.
A shortcut distillation calculation for the height of the column for constant relative volatility can be estimated from the Fenske equation,

where Nmin is the minimum number of theoretical trays at infinite reflux and ![]() is the geometric mean of the relative volatility calculated using the column top and bottom compositions, T and P. Typically, the number of actual trays is Nact ~ 4Nmin, with the space between trays being 0.6m. So a column with 99 and 1% splits and a relative volatility of 3 would have Nmin = 8.4 and a height of 20 m. With this background, the importance of the K-ratios and αLH becomes clear. Note that if αLH = 1, then Nmin = ∞. The relative volatility changes with composition for nonideal systems, and goes to 1 when an azeotrope exists. Then Eqn. 10.35 is not valid. We discuss such behavior in the following sections, and find significant motivation to understand the modeling of such systems in subsequent chapters.
is the geometric mean of the relative volatility calculated using the column top and bottom compositions, T and P. Typically, the number of actual trays is Nact ~ 4Nmin, with the space between trays being 0.6m. So a column with 99 and 1% splits and a relative volatility of 3 would have Nmin = 8.4 and a height of 20 m. With this background, the importance of the K-ratios and αLH becomes clear. Note that if αLH = 1, then Nmin = ∞. The relative volatility changes with composition for nonideal systems, and goes to 1 when an azeotrope exists. Then Eqn. 10.35 is not valid. We discuss such behavior in the following sections, and find significant motivation to understand the modeling of such systems in subsequent chapters.
10.7. Nonideal Systems
In Section 10.3 we introduced Raoult’s law for mixtures where the components have very similar chemical functionality and molecular weight. We have seen how easy the ideal-solution calculations can be. However, Raoult’s law is accurate for only a few of the systems you will encounter in practice. Examples of phase diagrams which deviate from Raoult’s law are shown in Fig. 10.8 and Fig. 10.9. There are several features of these diagrams that introduce important concepts. First of all, the Raoult’s law bubble lines are shown as dotted lines in the P–x–y diagrams to emphasize the deviations. Note again that the phase diagrams of each P-x-y/T-x-y pair can be qualitatively related by inverting one diagram of the pair.
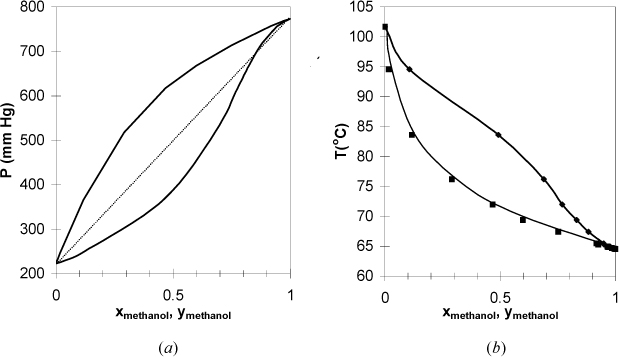
Figure 10.8. (a), (b) Phase behavior of the methanol + 3-pentanone system. Left figure at 65°C. Right figure at 760 mm Hg. (T-x-y from Glukhareva, M.I., et al. 1976. Zh. Prikl. Khim. (Leningrad) 49:660, P-x-y calculated from fit of T-x-y.)
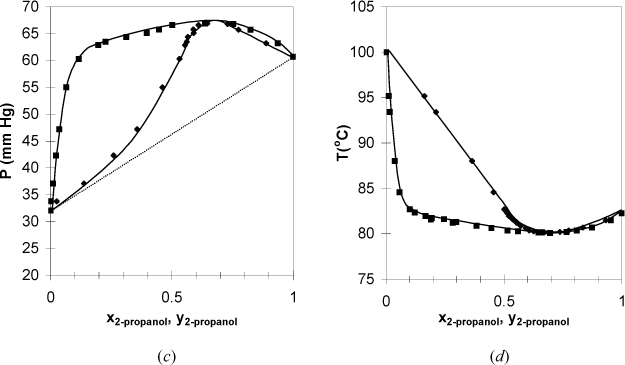
Figure 10.8. (c), (d) Phase behavior of the 2-propanol + water system. Left figure at 30°C. Right figure at 760 mm Hg. (T-x-y from Wilson, A., Simons, E.L., 1952. Ind. Eng. Chem. 44:2214, P-x-y from Udovenko, V.V., and Mazanko. T.F. 1967. Zh. Fiz. Khim. 41:1615.)
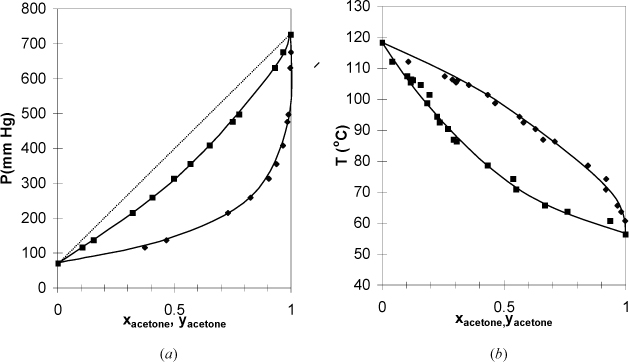
Figure 10.9. (a), (b) Phase behavior of the acetone + acetic acid system. Left figure at 55°C. Right figure at 760 mm Hg. (T-x-y from York, R., Holmes, R.C. 1942. Ind. Eng. Chem. 34:345, P-x-y from Waradzin, W., Surovy, J., 1975. Chem. Zvesti 29:783.)
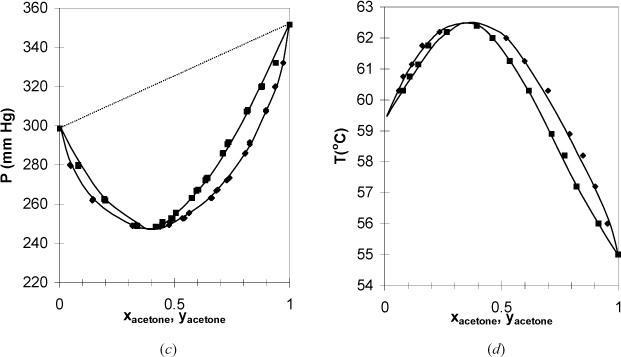
Figure 10.9. (c); (d) Phase Behavior of the acetone + chloroform system. Left figure at 35.17°C. Right figure at 732 mm Hg. (T-x-y from Soday, F., Bennett, G.W., 1930. J. Chem. Educ. 7:1336, P-x-y from Zawidzki, V.J., 1900. Z. Phys. Chem. 35:129.)
![]() Positive deviations from Raoult’s law. It is convenient to say that the components “dislike” each other.
Positive deviations from Raoult’s law. It is convenient to say that the components “dislike” each other.
In Fig. 10.8 the bubble line lies above the Raoult’s law line, and these systems are said to have positive deviations from Raoult’s law. Positive deviations occur when the components in the mixture would prefer to be near molecules of their own type rather than near molecules of the other component. Briefly, it is convenient to say that these components “dislike” each other. The 2-propanol + water system has vapor pressures that are close to each other relative to the deviation from ideality. As a result, the positive deviations are large enough to cause the pressure to reach a maximum (i.e,. Pmax > P1sat > P2sat). The presence of a maximum (or minimum) causes the phase envelope to close at a composition known as the azeotropic composition. The nearness of the vapor pressures matters, because any deviation from ideality would give a maximum (or minimum), known as an azeotrope, if P1sat = P2sat. As a counterexample, the methanol + 3-pentanone system has significantly different vapor pressures for the components, and the deviations from ideality are not large enough to cause azeotrope formation. Recalling that the dew and bubble lines represent coexisting compositions at equilibrium, a maximum or minimum means that xi = yi and relative volatility αij = 1 at the azeotrope: αij > 1 on one side of the azeotrope composition and αij < 1 on the other side. This means that distillation ceases to provide separation at an azeotrope composition, and knowledge of azeotropes is critical for distillation design. When an azeotrope forms in a system with positive deviations, the azeotrope is a maximum on the P-x-y diagram and a minimum on the T-x-y diagram. To give a name to the type of azeotrope, the convention is to refer to azeotropes like that of 2-propanol + water as a minimum boiling azeotrope, referring to the boiling temperature reaching a minimum in composition. This can be confusing because the deviations from ideality are referred to as positive with respect to Raoult’s Law on a P-x-y diagram. If you remember that “boiling” refers to boiling temperature, it may help you to reduce confusion. The azeotrope on a P-x-y diagram is a maximum pressure azeotrope. Since the vapor and liquid compositions are equivalent at the azeotrope, a flash drum or distillation column cannot separate a mixture at the azeotropic composition.
![]() Relative volatility equals 1 for an azeotrope: αij > 1 on one side of the azeotrope composition and αij < 1 on the other side.
Relative volatility equals 1 for an azeotrope: αij > 1 on one side of the azeotrope composition and αij < 1 on the other side.
Azeotropes create challenges for chemical engineers. Azeotropic compositions for systems with either positive or negative deviations depend on temperature and pressure, however the dependencies are usually weak unless large pressure or temperature changes are made. For example, the ethanol + water system possesses an azeotrope that is widely known. This azeotrope causes a significant contribution to the high energy cost of bioethanol. Separating ethanol from the dilute fermentation product stream consumes about one-third of the energy content of the ethanol. Are there ways to separate ethanol more efficiently? Are there alternative fermentation products that can be produced without an azeotrope? Could fermentation (and copious amounts of water) be circumvented altogether and cellulose converted directly to chemical feedstocks similar to how heavy oils are cracked to ethylene? These are questions that a chemical engineering perspective brings to bear on these challenging problems. In the thermodynamics of phase equilibria, we are primarily concerned with distillation, liquid-liquid extraction, and azeotropes. Ideal solutions do not form azeotropes and they do not form immiscible liquid phases. Thus, Raoult’s law is incapable of representing these systems.
![]() Ideal solutions do not form azeotropes and they do not form immiscible liquid phases.
Ideal solutions do not form azeotropes and they do not form immiscible liquid phases.
![]() Negative deviations from Raoult’s law. It is convenient to say that the components “like” each other.
Negative deviations from Raoult’s law. It is convenient to say that the components “like” each other.
In Fig. 10.9 the systems have negative deviations from Raoult’s law because the bubble line lies below the Raoult’s line. Similar azeotropic behavior is found in these systems if the vapor pressures are close to each other or the deviations are large. When an azeotrope forms in a system with negative deviations, the azeotrope is a minimum on the P-x-y diagram and a maximum on the T-x-y diagram. Therefore, this behavior is called a maximum boiling azeotrope or a minimum pressure azeotrope. From a chemical perspective, negative deviations indicate that the components “like” each other more than they like themselves. For example, mixing two acids may form an ideal solution, but mixing an acid with a base can give a negative deviation from ideality that feels warm to the touch. This is consistent with the negative sign on exothermic heats of reaction.
To better understand the reasons that mixtures deviate from Raoult’s law, we need to explore the fundamental thermodynamic principles and the assumptions underlying Raoult’s law. In doing so, we reveal the thermodynamic behavior that is necessary for Raoult’s law, and more greatly appreciate the reasons for the occasional success and more frequent failure of the model. Raoult’s law was developed empirically. To understand the true thermodynamic basis of Raoult’s law, it is necessary to “evaluate” how thermodynamic properties depend on composition. In addition, we can show that the fugacity used in Chapter 9 for pure fluids extends to mixtures and the component fugacity is the starting point for phase equilibria in mixtures. Raoult’s law involves specific assumptions about component fugacities for both the vapor and liquid phases. We develop models for deviations from Raoult’s law in Chapters 11–13.
Leave a Reply