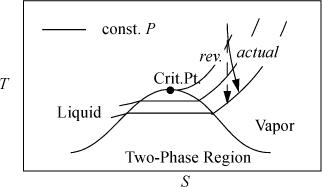
For a reversible adiabatic turbine, the entropy balance in Section 4.6 shows that the outlet entropy must equal the inlet entropy. For an irreversible turbine, the outlet entropy must be greater than the inlet entropy. We may now visualize the state change on the diagrams sketched in Section 4.8. For example, on a T-S diagram, the performance of a turbine can be visualized as shown in Fig. 4.9. Note that the isobars are important in sketching the behavior because the outlet pressure must be the same for the reversible and irreversible turbines, but the outlet enthalpies (not shown) and entropies must be different.

Figure 4.9. Illustration of a reversible and actual (irreversible) turbine on a T-S diagram.
![]() The outlet entropy of an irreversible adiabatic turbine will be greater than the outlet entropy of a reversible adiabatic turbine with the same outlet pressure.
The outlet entropy of an irreversible adiabatic turbine will be greater than the outlet entropy of a reversible adiabatic turbine with the same outlet pressure.
Steam Quality Calculations
![]() The actual outlet state might be in the one-phase region when the reversible outlet state is in the two-phase region.
The actual outlet state might be in the one-phase region when the reversible outlet state is in the two-phase region.
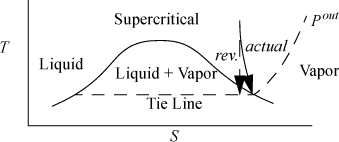
A common problem encountered when adiabatically reducing the pressure of real fluids like steam, methane, or refrigerants is the formation of a vapor-liquid mixture. Since the thermodynamic properties change dramatically depending on the mass fraction that is vapor (the quality), it is important to know how to calculate that fraction. The calculation procedure may differ from the case shown in Fig. 4.9 where the outlets for the reversible and irreversible cases are both one phase. Since the reversible adiabatic turbine is isentropic, the line representing the reversible process must be vertical. As shown in Fig. 4.10, if the upstream entropy is less than the saturated vapor entropy at the outlet pressure, the reversible outlet ends up inside the liquid-vapor region, to the left of the saturated vapor curve. In this case, we must perform a quality calculation to determine the vapor fraction. Since the actual turbine must have an outlet state of higher entropy, due to entropy generation, the outlet state can lie inside the phase envelope, on the saturation curve, or outside the phase envelope, depending on the proximity of the reversible outlet state to the saturation curve and also depending on the turbine efficiency. A frequent question is, “How do I know when I need a quality calculation?” The calculation is required if the inlet entropy is less than the saturation entropy at the outlet pressure as illustrated in the figure. A quality calculation may also be required for the actual state, if the actual enthalpy turns out to be less than the saturation enthalpy at the outlet pressure.

Figure 4.10. Illustration of need for quality calculation on turbine outlet where the actual outlet is saturated steam.
The best way to master turbine calculations is to practice; the examples in this section are designed to facilitate your effort. Example 4.13 explores the inference of outlet conditions and proper application of turbine efficiency. Example 4.14 illustrates calculation of turbine efficiency. Example 4.15 illustrates the determination of inlet conditions to match a desired outlet. The combinations of inlet and outlet specifications are too many to enumerate. Therefore, you need to practice inferring the necessary procedure for any given situation. Challenge yourself to repeat the examples without looking at the steps. Several practice problems are also given at the end of the chapter, with detailed solutions available at the textbook web site. As you practice, pay attention to the results and look for generalities that broaden your comprehension.
Determining Turbine Outlet Conditions
Let us work a series of examples illustrating the various situations that may arise in calculation of turbine outlets. Usually, the design of a turbine involves a given inlet state and outlet pressure. That outlet pressure may be specified explicitly, or it may be implicit in a statement giving the outlet temperature and the quality; it may be inferred then that the outlet pressure is the saturation pressure at the given temperature. An important skill is to quickly determine whether the reversible turbine follows Fig. 4.9 or whether it follows Fig. 4.10. Subsequently, for the cases that follow Fig. 4.10, the outlet state may lie inside or outside the phase envelope. The determination depends on the efficiency and the inlet entropy, with the following cases:
i. Reversible outlet one phase, actual outlet one phase;
ii. Reversible outlet two phase, actual outlet one phase;
iii. Reversible outlet two phase, actual outlet two phase.
This example, though long, comprehensively covers the solution methods to determine turbine outlets for single-stage turbines from a known inlet state and specified pressure drop.
Example 4.13. Various cases of turbine outlet conditions
An adiabatic turbine inlet (state 1) is 500°C and 1.4 MPa. For each of the following outlet conditions (state 2), determine the specified quantities.
a. P2 = 0.6 MPa, ηE = 0.85. Find WS, H2, S2, and T2.
b. P2 = 0.03 MPa, ηE = 0.85. Find WS, H2, S2, and T2.
c. P2 = 0.01 MPa, ηE = 0.9. Find WS, H2, S2, and T2.
Note that using a common inlet state for each of the cases will permit us to skip the steps to determine the inlet state as we work the different alternatives.
Solution
First, the inlet properties are determined: H1 = 3474.8 kJ/kg, S1 = 7.6047 kJ/kg-K. The reversible calculation is performed for each outlet condition, recognizing that a reversible turbine is isentropic.
a. S2′ = S1 = 7.6047 kJ/kg-K. Comparing with SsatV= 6.7593 kJ/kg-K at P2 = 0.6 MPa, S2′ > SsatV, so the reversible outlet state is superheated and any irreversibility must lead to greater entropy and greater superheat (case (i)). This is the case of Fig. 4.9. Interpolating:

By similar interpolation, T2′ = 367.5°C.
ΔH′ = WS′ = 3202.8 – 3474.8 = –272.0 kJ/kg
Applying ηE calculation, ΔH = WS = ηEΔH′ = 0.85(–272) = –231.2 kJ/kg,
H2 = H1 + ΔH = 3474.8 – 231.2 = 3243.6 kJ/kg
Preparing for interpolation:

By similar interpolation, T2 = 387.0°C. We see that irreversibility has warmed the outlet, but not “heated” it, because it was adiabatic. With a one-phase outlet, T2 > T2′ if ηE < 1.
b. The pressure is lower than part (a), and the saturated vapor S will be larger, and near the saturation boundary.
Recall that S2′ = S1 = 7.6047 kJ/kg-K. Comparing with SsatV= 7.7675 kJ/kg-K at P2 = 0.03 MPa, S2′ < SsatV, so the reversible outlet state is two-phase. This is the case of Fig. 4.10 and we need to proceed further to determine if the actual state is inside or outside the phase envelope. Interpolating using the saturation entropy values along with the S2′ at T2′ = 69.1°C,

Using Eqn. 1.27:
H2′ = 289.27 + 0.976(2335.28) = 2568.5 kJ/kg
ΔH′ = WS′ = 2568.5 – 3474.8 = – 906.3 kJ/kg
Applying ηE calculation, ΔH = WS = ηE ΔH′ = 0.85(–906.3) = –770.35 kJ/kg,
H2 = H1 + ΔH = 3474.8 – 770.35 = 2704.4 kJ/kg
Comparing H2 with HsatV = 2624.55 kJ/kg at P2 = 0.03 MPa, H2 > HsatV, so the outlet state is superheated (outside the phase envelope). This is an instance of case (ii).
To conclude the calculations, a double interpolation is required. Performing the first interpolation between 0.01 and 0.05 MPa will bracket the outlet state. (Note: 0.03 MPa is halfway between 0.01 and 0.05 MPa, so tabulated values are obtained by averaging rather than by a slower interpolation.)

Interpolating:

Similarly, by interpolation, T2 = 110.1°C.
Note: The reversible state is two-phase, and the actual outlet is one-phase for part (b). Also, S2 > S2′ = S1 and H2 > H2′ which are always true for irreversible turbines. T2 > T2′, which is a general result for one-phase output.
c. Very low-outlet pressures shifts the saturation value of S to even higher values, making it more likely that the outlet will be two phase, case (iii).
S2′ = S1 = 7.6047 kJ/kg-K. Comparing with SsatV= 8.1488 kJ/kg-K at P2 = 0.01 MPa, S2′ < SsatV, so the reversible outlet state is two-phase. This is the case of Fig. 4.10 and we need to proceed further to determine if the actual state is inside or outside the phase envelope. Interpolating at P = 0.01 MPa (T2′ = 45.81°C),

Using Eqn. 1.27,
H2′ = 191.81 + 0.9274(2392.05) = 2410.2 kJ/kg
ΔH′ = WS′ = 2410.3 – 3474.8 = – 1064.6 kJ/kg
Applying ηE calculation, ΔH = WS = ηE ΔH′ = 0.90(–1064.6) = –958.1 kJ/kg,
H2 = H1 + ΔH = 3474.8 – 958.1 = 2516.7 kJ/kg.
Comparing H2 with HsatV = 2583.86 kJ/kg at P2 = 0.01 MPa, H2 < HsatV, so the actual outlet state is two-phase as well as the reversible outlet (case (iii)). For the actual outlet, H2 gives:

Using Eqn. 1.27,
S2 = 0.6492 + 0.972(7.4996) = 7.9388 kJ/kg
The actual outlet is wet steam at T2 = 45.81°C. The reversible outlet and the actual outlet are both wet steam for part (c). Also, S2 > S2′ = S1 and H2 > H2′ which are always true for irreversible turbines. For case (c), T2 = T2′, however q2 > q2′, a general result for a two-phase outlet.
This example has exhaustively covered the possibilities that may occur when performing turbine analysis given a specified pressure drop and known inlet condition. The actual outlet enthalpy and entropy are always greater than the reversible values. The actual outlet T will be the same as the reversible T if both states are wet steam. Note that many variations could generate calculations that appear to be different from these cases, but are actually similar. For example, the quality could be specified at the outlet instead of the efficiency. Similarly, the steam outlet H or S, etc. could be specified rather than the quality. For any problem, the details of the interpolation may differ for a given application depending on the region of the steam tables. Nevertheless, the overall procedures of using entropy to identify the reversible state and then correcting for the actual state are always the same. The following example illustrates a typical turbine calculation that might be used to characterize the efficiency of a working turbine.
Example 4.14. Turbine efficiency calculation
An adiabatic turbine inlet is at 500°C and 1.4 MPa. Its outlet is at 0.01MPa and q = 99%.
a. Compute the work of the turbine.
b. Compute the work of a reversible turbine.
c. Compute the efficiency of the turbine and the entropy generation of the actual turbine.
Solution
The energy balance is ΔH = WS.
a. The inlet is the same as Example 4.13: H1 = 3474.8; S1 = 7.6047. At the outlet,
H2 = 191.81 + 0.99(2392.05) = 2559.9 kJ/kg
ΔH = WS = 2559.9 – 3474.8 = –914.9 kJ/kg
b. Entropy balance: ΔS′ = 0 ⇒ S2′ = S1 = 7.6047 kJ/kg-K.
It is slightly ambiguous whether we should match the outlet pressure or the specification of quality. By convention, it is assumed that pressure is the desired criterion (or temperature in a similar situation) because this pertains to the physical constraints of the design. This means that the reversible work is the same as Example 4.13(c) and WS′ = –1064.6 kJ/kg.
c. The turbine efficiency is defined by ηE = WS/WS′ = 914.9/1064.6 = 85.9%. The entropy generation is given by Sgen = S2 – S2′.
S2 = 0.6492 + 0.99(7.4996) = 8.0738 kJ/kg-K
Referring to the entropy balance, S2′ = S1 = 7.3046 so Sgen = 8.0738 – 7.6047 = 0.4691 J/g-K.
Another type of calculation involves determining a turbine inlet that will result in a certain outlet. The procedure is to use the outlet state to estimate the inlet entropy as a crude guess, and then use trial and error inlet conditions until the desired outlet state is matched.
Example 4.15. Turbine inlet calculation given efficiency and outlet
An adiabatic turbine outlet (state 2) is 99% quality steam at 0.01 MPa, ηE = 85%. The inlet pressure has been specified as 0.6 MPa. An absolute pressure of 0.6 MPa is conventionally defined as low pressure steam and is often applied in chemical processing. Find WS, H1, S1, and T1.
Solution
“Coincidentally,” the outlet properties were determined in Example 4.14: H2 = 2559.9; S2 = 8.0738. Referring to the superheated steam tables at 0.6 MPa, we seek an entropy value that is less than 8.0738 kJ/kg-K because ηE < 100% means entropy is generated. This occurs around 500°C. Trying 500°C, gives H1 = 3483.4 kJ/kg and S1 = 8.0041 kJ/kg-K. Then WS = –923.5 kJ/kg; q′ = (8.0041 – 0.6492)/7.4996 = 0.9807;
So H1′ = 191.8 + 0.9807(2392)=2537.6 kJ/kg; WS′ = 2537.6 – 3483.4 = –945.8 kJ/kg;
Wlost = 945.8 – 923.5 = 22.3 kJ/kg; ηE = –923.5/(–923.5 – 22.3) = 97.7%.
Further trials generate the values tabulated below. The last temperature is estimated by interpolation. (Hint: It would be great practice for you to compute these and check your answers.).

Multistage Turbines
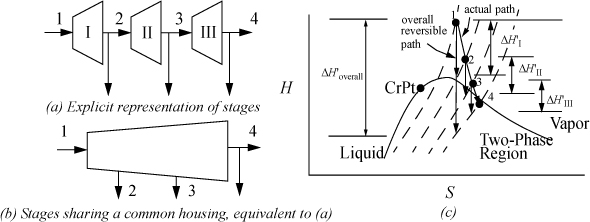
Commonly, turbines are staged for several reasons that we explore in Chapter 5. Generally, some steam is drawn off at intermediate pressures for other uses. The important point that needs to be stressed now is that the convention used for characterizing efficiency is important. Consider the three-stage turbine shown in Fig. 4.11 and the schematic that represents the overall reversible path and the actual path. The isobars on the H-S diagram for water curve slightly upward, and are spaced slightly closer together at the bottom of the diagram than at the top. The overall efficiency is given by ![]() , and the efficiency of an individual stage is given by
, and the efficiency of an individual stage is given by ![]() . If we consider the reversible work as ΔH′overall, that quantity must be smaller than
. If we consider the reversible work as ΔH′overall, that quantity must be smaller than ![]() . In fact, because the isobar spacing is increasing to the right of the diagram, the vertical drop between any isobars on the line marked as the overall reversible path must be smaller than the vertical drop between the same two isobars starting along the actual path (except for the very first turbine). Therefore, the efficiency calculated for the overall system must be higher than the efficiency for the individual stages. This comparison does not imply that staging turbines alters their performance. The difference in efficiencies is due to differences in what is considered to be the basis for the reversible calculation. The cautionary note to retain from this discussion is that the distinction between overall or individual efficiencies is important when communicating the performance of a staged turbine system.
. In fact, because the isobar spacing is increasing to the right of the diagram, the vertical drop between any isobars on the line marked as the overall reversible path must be smaller than the vertical drop between the same two isobars starting along the actual path (except for the very first turbine). Therefore, the efficiency calculated for the overall system must be higher than the efficiency for the individual stages. This comparison does not imply that staging turbines alters their performance. The difference in efficiencies is due to differences in what is considered to be the basis for the reversible calculation. The cautionary note to retain from this discussion is that the distinction between overall or individual efficiencies is important when communicating the performance of a staged turbine system.

Figure 4.11. Illustration that overall efficiency of an adiabatic turbine will be higher than the efficiency of the individual stages.
Leave a Reply