Chemical engineers must be proficient at including reacting systems into energy balances, and there are several key concepts that must be introduced. In reacting systems the number of moles is not conserved unless the number of moles of products is the same as the number of moles of reactants. Generally, the two best approaches for tracking species are to use an atom balance or to use the reaction coordinate. Here we will introduce the method of the reaction coordinate because it is much easier to incorporate into the energy balance. It is convenient to adopt the conventions of stoichiometry,
v1C1 + v2C2 + v3C3 + v4C4 = 0
where the C’s represent the species, and reactants have negative v’s and products have positive v’s. The v’s are called the stoichiometric numbers, and the absolute values are called the stoichiometric coefficients. (e.g., CH4 + H2O ![]() CO + 3H2, numbering from left to right),
CO + 3H2, numbering from left to right),
⇒ v1 = –1; v2 = –1; v3 = +1; v4 = +3.
Consider what would happen if a certain amount of component 1 were to react with component 2 to form products 3 and 4. We see dn1 = dn2 (v1 / v2) because v1 moles of component 1 requires v2 moles of component 2 in order to react. Rearranging:

Since all these quantities are equal, it is convenient to define a variable which represents this quantity.

ξ is called the reaction coordinate1 and is related to the conversion.2 Integrating:
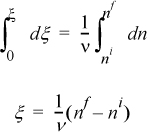
Or in a more useful form for any component i:

In a flowing system, ![]() represents the outlet,
represents the outlet, ![]() represents the inlet, and thus for component i,
represents the inlet, and thus for component i,

where ![]() represents the overall rate of species interconversion. Moles are not conserved in a chemical reaction, which can be quantified by summing Eqn. 3.40 or 3.41 over all species—for a flowing system,
represents the overall rate of species interconversion. Moles are not conserved in a chemical reaction, which can be quantified by summing Eqn. 3.40 or 3.41 over all species—for a flowing system, ![]() and
and ![]() , thus,
, thus,

In closed systems, the value of ξ is determined by chemical equilibria calculations; ξ may be positive or negative. The only limit on ξ is that ![]() for all i. The boundary values of ξ may be determined in this manner before beginning an equilibrium calculation. Naturally, in a flowing system, the same arguments apply to
for all i. The boundary values of ξ may be determined in this manner before beginning an equilibrium calculation. Naturally, in a flowing system, the same arguments apply to ![]() and
and ![]() .
.
Example 3.4. Stoichiometry and the reaction coordinate
Five moles of hydrogen, two moles of CO, and 1.5 moles of CH3OH vapor are combined in a closed system methanol synthesis reactor at 500 K and 1 MPa. Develop expressions for the mole fractions of the species in terms of the reaction coordinate. The components are known to react with the following stoichiometry:
2H2(g) + CO(g) ![]() CH3OH(g)
CH3OH(g)
Solution
Although the reaction is written as though it will proceed from left to right, the direction of the actual reaction does not need to be known. If the reverse reaction occurs, this will be obvious in the solution because a negative value of ξ will be found. The task at hand is to develop the mole balances that would be used toward determining the value of ξ. The table below presents a convenient format.
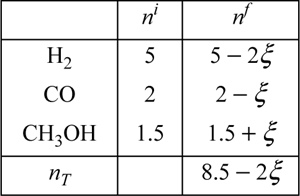
The total number of moles at any time is 8.5 – 2ξ. The mole fractions are
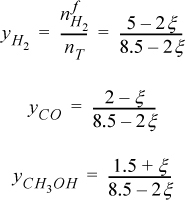
To ensure that all ![]() , the acceptable upper limit of ξ is determined by CO, and the acceptable lower limit is determined by CH3OH,
, the acceptable upper limit of ξ is determined by CO, and the acceptable lower limit is determined by CH3OH,
–1.5 ≤ ξ ≤ 2
Example 3.5. Using the reaction coordinates for simultaneous reactions
For each independent reaction, a reaction coordinate variable is introduced. When a component is involved in two reactions, the moles are related to both reaction coordinates. This example is available as an online supplement.
Standard State Heat of Reaction
When a reaction proceeds, bonds are broken, and others are formed. Because the bond energies vary for each type of bond, there are energy and enthalpy changes on reaction. Bond changes have a significant effect on the energy balance because they are usually larger than the sensible heat effects. Because enthalpies are state properties, we can use Hess’s law to calculate the enthalpy change. Hess’s law states that the enthalpy change of a reaction can be calculated by summing any component reactions, or by calculating the reaction enthalpy along a convenient reaction pathway between the reactants and products. To organize calculations of the changes, enthalpies of components are usually available at a standard state. A standard state is slightly different from a reference state as discussed on page 63. A standard state requires all the specifications of a reference state, except the T is the temperature of the system. For reactions, the conventional standard state properties are at a specified composition, state of aggregation, and pressure, but they change with temperature. By combining Hess’s law with the standard state concept, we may calculate the standard state heat (or enthalpy) of reaction. Suppose that we have the reaction of Fig. 3.4. For calculation of the heat of reaction, a convenient pathway is “decompose” the reactants into the constituent elements in their naturally occurring states at the standard state conditions, and then “reform” them into the products. The enthalpy of forming each product from the constituent elements is known as the standard heat (or enthalpy) of formation. The enthalpy change for “decomposing” the reactants is the negative of the heat of formation.

Figure 3.4. Illustration of the calculation of the standard heat of reaction by use of standard heats of formation.
We may write this mathematically using the stoichiometric numbers as:

where every term in the equation varies with temperature. Frequently, the standard state pressure is 1 bar. When a reaction is not at 1 bar, the usual practice is to incorporate pressure effects into the energy balance as we will show later, rather than using a heat of reaction at the high pressure. If we specify a reference temperature in addition to the other properties used for the standard state, we can calculate the ![]() at any temperature by using the heat capacity of the reactants and products,
at any temperature by using the heat capacity of the reactants and products,

where ![]() . A reaction with a negative value of
. A reaction with a negative value of ![]() is called an exothermic reaction. A reaction with a positive value of
is called an exothermic reaction. A reaction with a positive value of ![]() is called an endothermic reaction. In this equation,
is called an endothermic reaction. In this equation, ![]() is easily determined if the standard heat of reaction
is easily determined if the standard heat of reaction ![]() is known at a single reference temperature and 1 bar.
is known at a single reference temperature and 1 bar.

This is Eqn. 3.43, with an additional specification of temperature which creates a reference state. Almost always, the best reference state to use is TR = 298.15 K and 1 bar, because this is the temperature where the standard state enthalpies (heats) of formation are commonly tabulated. The heat of formation is taken as zero for elements that naturally exist as molecules at 298.15 K and 1 bar. Then the zero value is set for the state of aggregation naturally occurring at 298.15 K and 1 bar. For example, H exists naturally as H2(g), so ![]() is zero for H2(g). Carbon is a solid, so the value of
is zero for H2(g). Carbon is a solid, so the value of ![]() is zero for C(s). The zero values for elements in the naturally occurring state are often omitted in the tables in reference books. Enthalpies of formation are tabulated for many compounds in Appendix E at 298.15 K and 1 bar.
is zero for C(s). The zero values for elements in the naturally occurring state are often omitted in the tables in reference books. Enthalpies of formation are tabulated for many compounds in Appendix E at 298.15 K and 1 bar.
The state of aggregation must be specified in the reaction and care should be used to obtain the correct value from the tables. Some molecules, like water, commonly exist as vapor (g), or liquid (l). Note that for water, the difference between ![]() and
and ![]() is nearly the heat of vaporization at 298.15 K that can be obtained from the steam tables except that a minor pressure correction has been applied to correct the values from the vapor pressure to 1 bar.
is nearly the heat of vaporization at 298.15 K that can be obtained from the steam tables except that a minor pressure correction has been applied to correct the values from the vapor pressure to 1 bar.
The full form of the integral of Eqn. 3.44 is tedious to calculate manually, e.g., if CP, i = ai + bi T + ci T2 + di T3, Eqn. 3.44 becomes

where ![]() , and heat capacity constants b, c, and d are handled analogously. The value of the constant J is found by using a known numerical value of ΔHRo in the upper equation (e.g., 298.15K) and setting the temperature to TR.
, and heat capacity constants b, c, and d are handled analogously. The value of the constant J is found by using a known numerical value of ΔHRo in the upper equation (e.g., 298.15K) and setting the temperature to TR.
Energy Balances for Reactions
To calculate heat transfer to or from a reactor system, the energy balance used in earlier chapters requires further consideration. To simplify the derivation of the energy balance for reactive systems, consider a single inlet stream and single outlet stream flowing at steady state:

For either the inlet stream or the outlet stream, the total enthalpy can be calculated by summing the enthalpy of the components plus the enthalpy of mixing at the stream temperature and pressure. To properly use Eqn. 3.47, the enthalpies of the inlets and outlets need to be related to the reaction. Two methods are used for energy balances, and both are equally valid. An overview of the concept pathways is illustrated in Fig. 3.5. To make a thermodynamic connection with the reaction, the Heat of Reaction method replaces the first two terms in Eqn. 3.47 with the negative sum of the three steps shown by dashed lines in Fig. 3.5(a). In contrast, the Heat of Formation method uses an elemental reference state for every component, and the enthalpies of each component include the heat of formation as illustrated by each branch of Fig 3.5(b). The difference of enthalpies of the components then includes the generalized steps of Fig. 3.4, and the heat of reaction is included implicitly when taking the difference in the two branches of Eqn. 3.5(b). The difference in the two branches represents the first two terms of Eqn. 3.47. The Heat of Reaction method is usually easiest for students to grasp, because of the explicit term for the heat of reaction. An advantage of the method is that an experimental heat of reaction can be readily used. Most process simulators use the Heat of Formation method. If you think about it, the Heat of Formation method does not require specification of exactly what reactions occur. Based on Hess’s law, the overall results can be related to the differences in the heats of formation of the outlet and the inlet species. The notation and the manipulated energy balances for the two methods look different, and the choice of the method depends on data available. The numerical results are the same if the thermochemical data are reliable for each method. Differences will be due to accuracies in the properties used for the pathways.
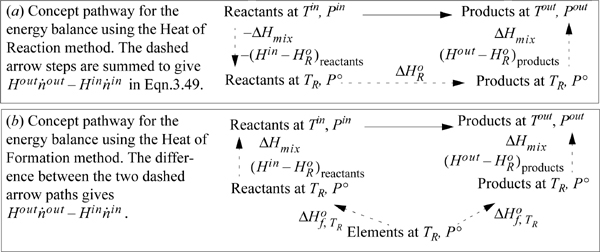
Figure 3.5. Concept pathways for (a) the Heat of Reaction method and (b) the Heat of Formation method. Details for the steps are omitted as discussed in the text.
Either method requires manipulation of stream enthalpies relative to the reference conditions. When discussing reference states in Section 2.11, convenient pathways were used. The reaction balance calculations require that the inlets and outlets be related to the standard state TR and Po using similar techniques, and often phase changes are necessary. Following our convention of hierarchical learning, we will use a simplified balance that ignores some of these terms (which are frequently small corrections anyway relative to the heat of reaction). In later chapters, we introduce methods to calculate them. By comparing the magnitude of terms for a particular application, you will then be able to evaluate their relative importance. Choices can be made for the route to calculate a stream enthalpy. One choice is to mix all the components at an ideal gas state and then correct for non-idealities of the mixture. Another route is to correct for non-ideal gas behavior of individual components, and then mix them together at the system T and P. For a system without phase transitions between TR and T, when calculating the mixing process after the pressure correction, the stream enthalpy relative to species at the standard state looks like this,

![]() Enthalpy of a mixed stream where there are no phase changes between TR and T.
Enthalpy of a mixed stream where there are no phase changes between TR and T.
where ![]() is the enthalpy of the species at the reference state, the pressure dependence of the enthalpy and the heat of mixing have been assumed to be small relative to the heat of reaction. Details on the pressure effects are developed in Chapters 6–8 and are expressed as an enthalpy departure; they are usually small relative to heats of reaction for gases. When the standard state is an ideal gas and liquid streams are involved, the correction is very important and –ΔHvap must be included in the path. The principle extends to solids as well. Heats of mixing are introduced beginning in Sections 11.4 and 11.10 and are typically small relative to reaction heats unless dissolving/neutralizing acids/bases or dissolving salts. Example 3.6 provides calculations including heats of vaporization for the components.
is the enthalpy of the species at the reference state, the pressure dependence of the enthalpy and the heat of mixing have been assumed to be small relative to the heat of reaction. Details on the pressure effects are developed in Chapters 6–8 and are expressed as an enthalpy departure; they are usually small relative to heats of reaction for gases. When the standard state is an ideal gas and liquid streams are involved, the correction is very important and –ΔHvap must be included in the path. The principle extends to solids as well. Heats of mixing are introduced beginning in Sections 11.4 and 11.10 and are typically small relative to reaction heats unless dissolving/neutralizing acids/bases or dissolving salts. Example 3.6 provides calculations including heats of vaporization for the components.
Heat of Reaction Method
It might not be immediately obvious that Eqn. 3.47 includes the heat of reaction. Considering just the flow terms of the energy balance, by plugging Eqn. 3.48 into Eqn. 3.47 the flow terms become

where the inlet temperature of all reactants is the same. The first term on the right of Eqn. 3.49 can be related to the heat of reaction using Eqn. 3.41 to introduce ξ and Eqn. 3.45 to insert the heat of reaction:

Therefore, the steady-state energy balance can be calculated using Eqn 3.51 and the balance is known as the Heat of Reaction method:

If you consider the first two terms and the last term, you can see how they represent the negative of the sum of the steps in Fig. 3.5(a). When multiple reactions occur, a reaction term can be used for each reaction. To use this expression correctly, the enthalpies of the inlet and outlet streams must be calculated relative to the same reference temperature where is known and any phase transitions at temperatures between the reference state and the inlet or outlet states must be included in ![]() . Also, the variable
. Also, the variable ![]() must be determined for the same basis as the molar flows. The temperature of 298.15 K is almost always the reference temperature for balances involving chemical reactions. There is less flexibility in choosing the reference temperature than for non-reactive systems. This method is easiest to apply with one or two reactions where the stoichiometry is known.
must be determined for the same basis as the molar flows. The temperature of 298.15 K is almost always the reference temperature for balances involving chemical reactions. There is less flexibility in choosing the reference temperature than for non-reactive systems. This method is easiest to apply with one or two reactions where the stoichiometry is known.
![]() An online supplement is available to relate the notation here to other common textbooks and includes other details.
An online supplement is available to relate the notation here to other common textbooks and includes other details.
Heat of Formation Method
The Heat of Formation method requires a reference state relative to the elements, and Eqn. 3.48 is modified by adding the heat of formation for each species. The stream enthalpy when there are no phase transitions between the reference state and the stream state looks like this:

![]() Enthalpy of a mixed stream where there are no phase changes between TR and T using the Heat of Formation method.
Enthalpy of a mixed stream where there are no phase changes between TR and T using the Heat of Formation method.
When phase changes are involved, the steps along the pathway are included as illustrated by several examples in Fig. Fig. 2.6 on page 65.
The energy balance is unmodified from Eqn. 3.47. The heat of reaction and the reaction coordinate are not needed explicitly, but the reaction coordinate is often helpful in determining the molar flows for the energy balance.
Work Effects
Usually shaft work and expansion/contraction work are negligible relative to other terms in the energy balance of a reactive system. They may usually be neglected without significant error.
Example 3.6. Reactor energy balances
Acetone (A) is reacted in the liquid phase over a heterogeneous acid catalyst to form mesityl oxide (MO) and water (W) at 80°C and 0.25 MPa. The reaction is 2A ![]() MO + W. Conversion is to be 80%. The heat capacity of mesityl oxide has been estimated to be CPL (J/mol-K) = 131.16 + 0.2710T(K), CPV (J/mol-K) = 72.429 + 0.2645T(K), and the acentric factor is estimated to be 0.356. Other properties can be obtained from Appendix E or webbook.nist.gov. Ignore pressure corrections and assume ideal solutions.
MO + W. Conversion is to be 80%. The heat capacity of mesityl oxide has been estimated to be CPL (J/mol-K) = 131.16 + 0.2710T(K), CPV (J/mol-K) = 72.429 + 0.2645T(K), and the acentric factor is estimated to be 0.356. Other properties can be obtained from Appendix E or webbook.nist.gov. Ignore pressure corrections and assume ideal solutions.

a. Estimate the heat duty for a steady-state reaction with liquid feed (100 mol/h) and liquid products. Use the Heat of Reaction method calculated using liquid heats of formation.
b. Estimate the heat duty for the same conditions as (a), but use the Heat of Formation method incorporating heats of formation of ideal gases and Eqn 2.45 to estimate heat of vaporization. (This method is used by process simulators.)
c. Repeat part (b) with the modification of using the experimental heat of vaporization.
d. Estimate the heat duty for the same conditions as (a), but use the Heat of Formation method incorporating the heat of formation of liquids.
Solution
a. For MO and A, ![]() , –249.4 kJ/mol respectively, from NIST. The liquid phase standard state heat of reaction is –221 – 285.8 – 2(–249.4) = –8 kJ/mol. Using a reference state of the liquid species at 298.15 K and 1 bar, the enthalpy of the each component is given by
, –249.4 kJ/mol respectively, from NIST. The liquid phase standard state heat of reaction is –221 – 285.8 – 2(–249.4) = –8 kJ/mol. Using a reference state of the liquid species at 298.15 K and 1 bar, the enthalpy of the each component is given by ![]() ; the results are {A, 7.265 kJ/mol}, {MO, 12.068}, {W, 4.161}. The mass balance for 100 mol/h A feed and 80% conversion gives an outlet of 100(1 – 0.8) = 20 mol/h A, then,
; the results are {A, 7.265 kJ/mol}, {MO, 12.068}, {W, 4.161}. The mass balance for 100 mol/h A feed and 80% conversion gives an outlet of 100(1 – 0.8) = 20 mol/h A, then, ![]() . The energy balance is
. The energy balance is ![]() , or
, or ![]()
b. The value of ![]() is the same. The path to calculate the component liquid enthalpies using the heat of formation for ideal gases is: form ideal gas at 298.15K → heat ideal gas to 353.15K → condense ideal gas at 353.15K (using Eqn. 2.45). For MO
is the same. The path to calculate the component liquid enthalpies using the heat of formation for ideal gases is: form ideal gas at 298.15K → heat ideal gas to 353.15K → condense ideal gas at 353.15K (using Eqn. 2.45). For MO ![]() , from NIST. The enthalpies of each component will be tabulated for each of the three steps: (A) –215.7 + 4.320 – 27.71 = –239.1 kJ/mol; (MO) –178.3 + 8.72 – 39.0 = –208.6 kJ/mol; (W) –241.8 + 1.86 – 42.7 = –282.6 kJ/mol. The energy balance is
, from NIST. The enthalpies of each component will be tabulated for each of the three steps: (A) –215.7 + 4.320 – 27.71 = –239.1 kJ/mol; (MO) –178.3 + 8.72 – 39.0 = –208.6 kJ/mol; (W) –241.8 + 1.86 – 42.7 = –282.6 kJ/mol. The energy balance is

In principle, this method should have given the same result as (a), but the value differs significantly. The method is sensitive to the accuracy of the prediction for the heat of vaporization. When this method is used, the accuracy of the heat of vaporization needs to be carefully evaluated.
c. To evaluate the effect of the prediction of the heat of vaporization, let us repeat with a modified path through the normal boiling point of the species, using the experimental heat of vaporization. The normal boiling point of MO from NIST is 403 K, and ΔHvap = 42.7 kJ/mol. The component enthalpy path is modified to: form ideal gas at 298.15 K → heat ideal gas to Tb → condense to liquid at Tb → change liquid to 353.15 K. The enthalpies of each step and totals are: (A) –215.7 + 2.4 –30.2 + 3.3 = –240.2 kJ/mol; (MO) –178.3 + 17.3 – 42.7 – 11.6 = –215.3 kJ/mol; (W) –241.9 + 2.5 – 40.7 – 1.5 = –281.6 kJ/mol. The energy balance is

Parts (b) – (c) result in different heat transfer compared to (a). Note the difference in the heat of formation of vapor and liquid MO at 25°C matches the heat of vaporization at the normal boiling point and the difference would be expected to be larger. The original references for the thermochemical data should be consulted to decide which is most reliable.
d. This modification will not require heats of vaporization. The component enthalpy path is: form liquid at 298.15 K and heat liquid to 353.15 K. The sensible heat calculations are the same as tabulated in part (a). The enthalpies for the two steps and sum for each component are:
(A) –249.4 + 7.265 = –242.1 kJ/mol; (MO) –221 + 12.068 = –208.9; (W) –285.8 + 4.2 = –281.6.
The energy balance becomes:

Comparing with (a), the Heat of Formation method and the Heat of Reaction method give the same results when the same properties are used.
Adiabatic Reactors
Suppose that a reactor is adiabatic ![]() . For the Heat of Reaction method, the energy balance becomes (for a reaction without phase transformations between TR and the inlets or outlets),
. For the Heat of Reaction method, the energy balance becomes (for a reaction without phase transformations between TR and the inlets or outlets),

and as before, any latent heats must be added to the flow terms. An exothermic heat of reaction will raise the outlet temperature above the inlet temperature. For an endothermic heat of reaction, the outlet temperature will be below the inlet temperature. At steady state, the system finds a temperature where the heat of reaction is just absorbed by the enthalpies of the process streams. This temperature is known as the adiabatic reaction temperature, and the maximum reactor temperature change is dependent on the kinetics and reaction time, or on equilibrium. For fixed quantities and temperature of feed, Eqn. 3.53 involves two unknowns, Tout and ![]() , and, if the reaction is not limited by equilibrium, the kinetic model and reaction time determine these variables. If a reaction time is sufficiently large, equilibrium may be approached. Equilibrium reactors will be considered in Chapter 17.
, and, if the reaction is not limited by equilibrium, the kinetic model and reaction time determine these variables. If a reaction time is sufficiently large, equilibrium may be approached. Equilibrium reactors will be considered in Chapter 17.
Graphical Visualization of the Energy Balance
The energy balance as presented by Method I (Eqn. 3.51) can be easily plotted for an adiabatic reaction. Let us replace the heat capacity polynomials with average heat capacities that are temperature independent. If we incorporate the material balance, Eqn. 3.41, the Heat of Reaction steady-state energy balance after rearranging becomes

where ![]() and c is frequently small. Neglecting c and dropping heat for an adiabatic reactor,
and c is frequently small. Neglecting c and dropping heat for an adiabatic reactor,

Consider the case of an exothermic reaction. A schematic of the energy balance is shown in Fig. 3.6 for an exothermic reaction. In the plot, we have neglected ![]() in the denominator which is often small relative to the summation and introduces a slight curvature if included. Note that an endothermic reaction will have an energy balance with a negative slope, making the plot for an endothermic reaction a mirror image of Fig. 3.6 reflected across a vertical line at Tin.
in the denominator which is often small relative to the summation and introduces a slight curvature if included. Note that an endothermic reaction will have an energy balance with a negative slope, making the plot for an endothermic reaction a mirror image of Fig. 3.6 reflected across a vertical line at Tin.
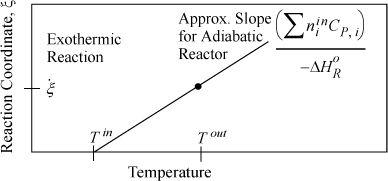
Figure 3.6. Approximate energy balance for an adiabatic exothermic reaction. The dot represents the outlet reaction coordinate value and the adiabatic outlet temperature. The plot for an endothermic reaction will be a mirror image of this figure as explained in the text.
Leave a Reply