Consider a pipe closed at both ends and filled with a liquid. The liquid is composed of a very large number of molecules, each one of which occupies a certain position in the stagnant body of the liquid. The position of the molecule is not completely fixed, as it would be in the case of a solid, nor is it completely random, as in the case of a gas. A molecule may exhibit a slight random motion; however, it can be considered to be in a state of dynamic equilibrium—an overall fixed position with respect to time. Now, valves are opened at both ends of the pipe and the liquid is allowed to flow continuously from an upstream source.
At low flow rates, the molecules tend to follow a straight-line trajectory in the flow direction. The position of a molecule does not change with respect to that of the neighboring molecules in the direction of flow, and there is little or no tendency on the part of the molecule to move in a direction perpendicular to the direction of the flow. In other words, flow is strictly in the axial direction with no transverse movement of the molecules.
As the flow rate increases, this orderly arrangement tends to get broken. Molecules start deviating from their linear trajectories and begin to mix with other molecules in both the axial and transverse directions. As the flow rate increases still further, the movement of molecules becomes highly randomized, resulting in complete mixing in the transverse direction. The flow in the first case can be visualized as a flow of parallel layers with no intermixing of layers—a laminar flow—and the flow in the latter case can be visualized as completely mixed flow—a turbulent flow.
The two distinct flow patterns can be observed visually by injecting a colored dye in the flow stream. Figure 5.1 shows the evidence of laminar and turbulent flows obtained through such an experiment [1]. The left side of the figure shows the linear trajectory traced by the colored particles in the laminar flow, and the right side shows how the particles get dispersed in the body of the fluid in the turbulent flow. This experiment was originally performed in 1883 by Osborne Reynolds (whose influence on the field of fluid mechanics cannot be overstated) and can be easily set up in any laboratory.

Figure 5.1 Laminar and turbulent flow.
Source: Olson, A. T., and K. A. Shelstad, Introduction to Fluid Flow and the Transfer of Heat and Mass, Prentice Hall, Englewood Cliffs, New Jersey, 1987.
5.1.1 Velocity Profiles in Laminar and Turbulent Flows
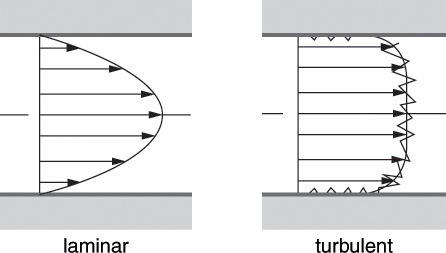
The distinction between laminar and turbulent flows becomes readily apparent from the velocity profiles—velocity of molecules or the particles as a function of position in the directions perpendicular to the flow direction, as shown in Figure 5.2 [2]. The velocity profile in laminar flow is parabolic, with zero velocity at the walls and maximum velocity at the center of the conduit. The velocity profile for turbulent flow, by contrast, is relatively flat, with most of the particles, except for those in a narrow region near the walls, having similar velocities.

Figure 5.2 Velocity profiles in laminar and turbulent flows.
Source: Oertel, H., Prandtl’s Essentials of Fluid Mechanics, Second Edition, Springer, New York, 2004.
The flow regime—laminar or turbulent—has a significant impact on the design and operation of the piping system. A chemical engineer designing such a system is required to specify the power requirements to move the material. It should be clear from this discussion that the phenomena occurring in the two regimes are fundamentally different. The power requirements have different dependence on system properties and operational conditions, and the engineer needs to have a quantitative criterion to determine if the flow is laminar or turbulent. The fundamental mathematical treatment of fluid flow phenomena is presented next.
Leave a Reply