What is Supply Curve?
Supply Curve definition: In economics, supply curve is a graphical representation of supply schedule is called supply curve.
In a graph, the price of a product is represented on Y-axis and quantity supplied is represented on X-axis.

Table of Content [Show]
Also Read: Law of Supply
Types of Supply Curve
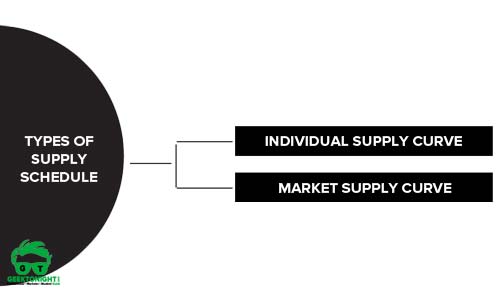
In, economics, Supply curve can be of two types, individual supply curve and market supply curve. These two types of supply curves are explained as follows:

Individual supply curve
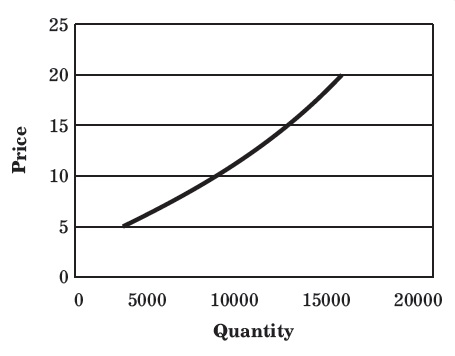
Individual supply curve: It is the graphical representation of individual supply schedule.
The individual supply schedule of commodity A represented in Table when plotted on a graph will provide the individual supply curve, which is shown in Figure.
| PRICE OF THE PRODUCT (₹ PER KG) | QUANTITY SUPPLIED OF COMMODITY A (KG PER WEEK) |
|---|---|
| 5 | 3,000 |
| 10 | 8,000 |
| 15 | 12,000 |
| 20 | 15,000 |

The slope moving upwards to the right in individual supply curve shows the direct relationship between supply and price, i.e. increase in supply along with the rise in prices.
Market Supply curve
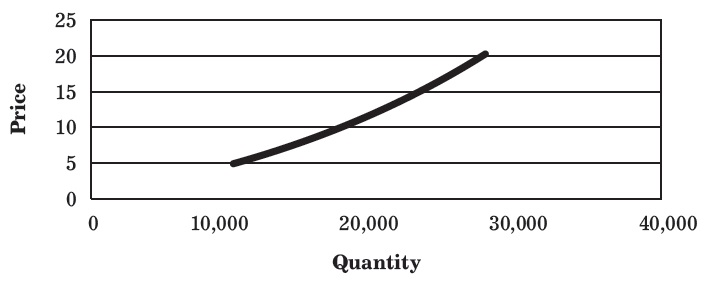
Market Supply curve: It is the graphical representation of market supply schedule.
The market supply schedule of commodity A (supplied by Firm X and Firm Y) represented in Table, when plotted on the graph will provide the market supply curve, which is shown in Figure.
Example
| PRICE OF PRODUCT A (₹ PER KG) | QUANTITY SUPPLIED BY FIRM X (1000 KG PER WEEK) | QUANTITY SUPPLIED BY FIRM Y (1000 KG PER WEEK) | MARKET SUPPLY (1000 KG PER WEEK) |
|---|---|---|---|
| 5 | 3 | 7 | 10 |
| 10 | 8 | 12 | 20 |
| 15 | 12 | 15 | 27 |
| 20 | 15 | 17 | 32 |

Leave a Reply