The functional relationship between saving and national income is known as Saving Function. It shows the savings of households during a given period of time at a given income level. In alternate terms, the savings function shows different savings levels at different income levels in an economy. Saving function is also known as Propensity to Save, and is represented by S = f(Y). The two types of Propensities to Save are Average Propensity to Save (APS) and Marginal Propensity to Save (MPS).
1. Average Propensity to Save (APS):
It is the ratio of saving to the corresponding income level. The formula to determine Average Propensity to Save (APS) is:
Example:
Calculate APS and prepare a diagram for the same from the following schedule.
| Income (Y) (₹ Crores) | Saving (S) (Y – C) (₹ Crores) |
|---|---|
| 0 | -60 |
| 100 | -50 |
| 200 | 0 |
| 300 | 60 |
| 400 | 80 |
Solution:
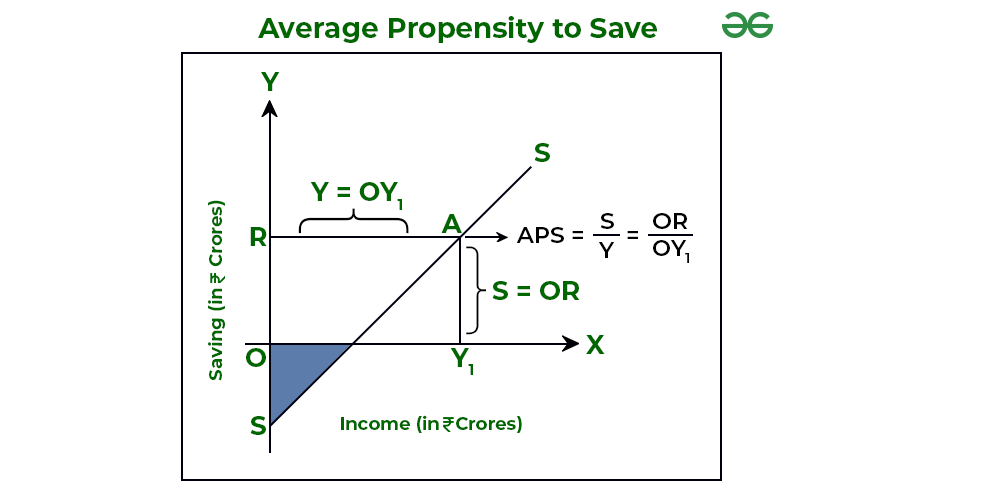
In the above table, we can see that the Average Propensity to Save at ₹100 crores income level is -0.5, as there is a negative savings of ₹50 crores, and as the savings, at ₹200 crores income level is zero, APS = 0.

In the above graph, income is represented on the X-axis and saving on the Y-axis, and SS is the savings curve. Also, APS at point A on the SS curve is equal to .
Important facts about APS
1. APS can never be one or more than one: As savings can never be equal to national income (because of autonomous consumption) and more than national income, APS can never be one or more than one.
2. APS can be zero: When the savings is zero, APS will be zero. This point is also known as Break-even Point.
3. APS can be negative or less than one: APS can be negative at all the income levels lower than the Break-even Point, because of dissavings in the economy.
4. APS increases with an increase in income: As the income increases, APS also increases because the proportion of income saved keeps on rising.
2. Marginal Propensity to Save (MPS):
It is the ratio of the change in saving to the change in total income. The formula to determine Marginal Propensity to Save (MPS) is:
Example:
Calculate MPS and prepare a diagram for the same from the following schedule.
| Income (Y) (₹ Crores) | Saving (S) (Y – C) (₹ Crores) |
|---|---|
| 0 | -80 |
| 100 | -40 |
| 200 | 0 |
| 300 | 40 |
| 400 | 80 |
Solution:
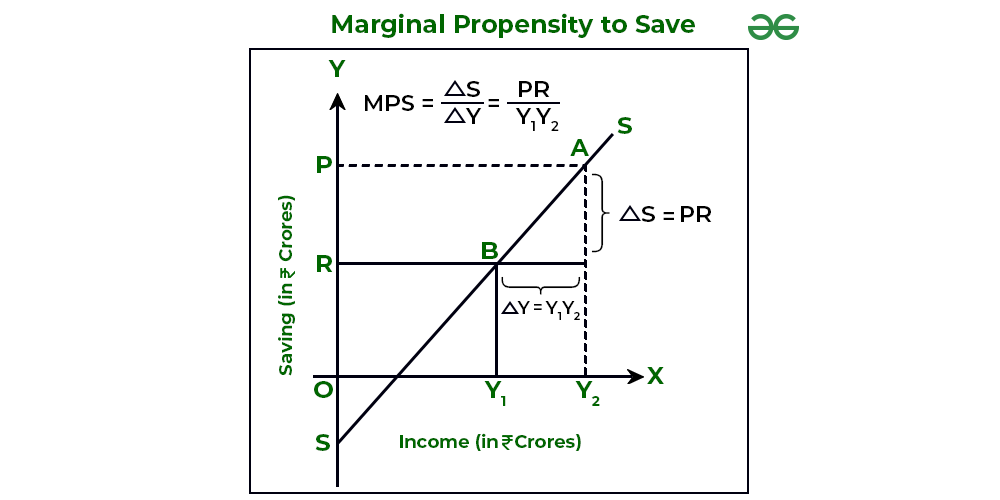
In the above table, when the income increases from 0 to ₹100 crores, MPS =0.4. Also, the value of MPS remains the same; i.e., 0.4 throughout the saving function.

As MPS measures saving curve’s slope, the constant value of the Marginal Propensity to Save means that the saving curve is a straight line. In the above graph, MPS at point A with respect to point B =
MPS varies between 0 and 1
As we know that the increment in income is either consumed or saved for future use. So, if the entire additional income is saved; i.e., if , then MPS = 1. However, if the entire additional income is consumed; i.e., if
, then MPS = 0. In normal situations, MPS lies between 0 and 1.
Difference between Average Propensity to Save (APS) and Marginal Propensity to Save (MPS)
| Basis | Average Propensity to Save (APS) | Marginal Propensity to Save (MPS) |
|---|---|---|
| Meaning | It is the ratio of saving to the corresponding income level. | It is the ratio of change in saving to the change in total income. |
| Value less than zero | When there are dissavings, Average Propensity to Save can be less than zero. It means consumption is more than national income (i.e., till the break-even point), APS will be less than zero. | As the change in saving can never be negative, Marginal Propensity to Save can never be less than zero. It means that as the change in consumption can never be more than change in income, MPS will never be less than zero. |
Leave a Reply