You have now seen two ways to describe how fast something moves: average velocity and average speed, both of which are measured over a time interval Δt. However, the phrase “how fast” more commonly refers to how fast a particle is moving at a given instant—its instantaneous velocity (or simply velocity) ν.
The velocity at any instant is obtained from the average velocity by shrinking the time interval Δt closer and closer to 0. As Δt dwindles, the average velocity approaches a limiting value, which is the velocity at that instant:

This equation displays two features of the instantaneous velocity ν. First, ν is the rate at which the particle’s position x is changing with time at a given instant; that is, ν is the derivative of x with respect to t. Second, ν at any instant is the slope of the particle’s position–time curve at the point representing that instant. Velocity is another vector quantity and thus has an associated direction.
Speed is the magnitude of velocity; that is, speed is velocity that has been stripped of any indication of direction, either in words or via an algebraic sign. (Caution: Speed and average speed can be quite different.) A velocity of +5 m/s and one of −5 m/s both have an associated speed of 5 m/s. The speedometer in a car measures speed, not velocity (it cannot determine the direction).
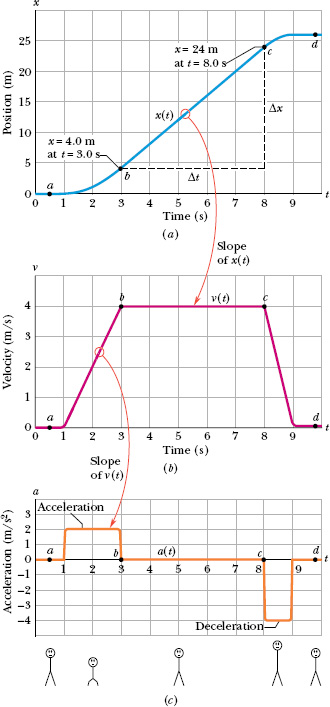
Figure 2-6a is an x(t) plot for an elevator cab that is initially stationary, then moves upward (which we take to be the positive direction of x), and then stops. Plot ν(t).
Solution: The Key Idea here is that we can find the velocity at any time from the slope of the x(t) curve at that time. The slope of x(t), and so also the velocity, is zero in the intervals from 0 to 1 s and from 9 s on, so then the cab is stationary. During the interval bc, the slope is constant and nonzero, so then the cab moves with constant velocity. We calculate the slope of x(t) then as

The plus sign indicates that the cab is moving in the positive x direction. These intervals (where ν = 0 and ν = 4 m/s) are plotted in Fig. 2-6b. In addition, as the cab initially begins to move and then later slows to a stop, ν varies as indicated in the intervals 1 s to 3 s and 8 s to 9 s. Thus, Fig. 2-6b is the required plot. (Figure 2-6c is considered in Section 2-6.)
Given a ν(t) graph such as Fig. 2-6b, we could “work backward” to produce the shape of the associated x(t) graph (Fig. 2-6a). However, we would not know the actual values for x at various times, because the ν(t) graph indicates only changes in x. To find such a change in x during any interval, we must, in the language of calculus, calculate the area “under the curve” on the ν(t) graph for that interval. For example, during the interval 3 s to 8 s in which the cab has a velocity of 4.0 m/s, the change in x is

(This area is positive because the ν(t) curve is above the t axis.) Figure 2-6a shows that x does indeed increase by 20 m in that interval. However, Fig. 2-6b does not tell us the values of x at the beginning and end of the interval. For that, we need additional information, such as the value of x at some instant.

Fig. 2-6 (a) The x(t) curve for an elevator cab that moves upward along an x axis. (b) The ν(t) curve for the cab. Note that it is the derivative of the x(t) curve (ν = dx/dt). (c) The a(t) curve for the cab. It is the derivative of the ν(t) curve (a = dv/dt). The stick figures along the bottom suggest how a passenger’s body might feel during the accelerations.
The position of a particle moving on an x axis is given by

with x in meters and t in seconds. What is its velocity at t = 3.5 s? Is the velocity constant, or is it continuously changing?
Solution: For simplicity, the units have been omitted from Eq. 2-5, but you can insert them if you like by changing the coefficients to 7.8 m, 9.2 m/s, and −2.1 m/s3. The Key Idea here is that velocity is the first derivative (with respect to time) of the position function x(t). Thus, we write

which becomes

At t = 3.5 s,

At t = 3.5 s, the particle is moving in the negative direction of x (note the minus sign) with a speed of 68 m/s. Since the quantity t appears in Eq. 2-6, the velocity ν depends on t and so is continuously changing.
![]() CHECKPOINT 3 The following equations give the position x(t) of a particle in four situations (in each equation, x is in meters, t is in seconds, and t > 0): (1) x = 3t − 2; (2) x = −4t2 − 2; (3) x = 2/t2; and (4) x = −2. (a) In which situation is the velocity ν of the particle constant? (b) In which is ν in the negative x direction?
CHECKPOINT 3 The following equations give the position x(t) of a particle in four situations (in each equation, x is in meters, t is in seconds, and t > 0): (1) x = 3t − 2; (2) x = −4t2 − 2; (3) x = 2/t2; and (4) x = −2. (a) In which situation is the velocity ν of the particle constant? (b) In which is ν in the negative x direction?
Leave a Reply