The momentum ![]() of any particle-like body cannot change unless a net external force changes it. For example, we could push on the body to change its momentum. More dramatically, we could arrange for the body to collide with a baseball bat. In such a collision (or crash, in everyday language), the external force on the body is brief, has large magnitude, and suddenly changes the body’s momentum. Collisions occur commonly in our world, often at great expense when they involve cars. We shall discuss car collisions soon, but first we need to consider a simpler collision in which a moving particle-like body (a projectile) collides with some other body (a target).
of any particle-like body cannot change unless a net external force changes it. For example, we could push on the body to change its momentum. More dramatically, we could arrange for the body to collide with a baseball bat. In such a collision (or crash, in everyday language), the external force on the body is brief, has large magnitude, and suddenly changes the body’s momentum. Collisions occur commonly in our world, often at great expense when they involve cars. We shall discuss car collisions soon, but first we need to consider a simpler collision in which a moving particle-like body (a projectile) collides with some other body (a target).
Single Collision
Let the projectile be a ball and the target be a bat. The collision is brief, and the ball experiences a force that is great enough to slow, stop, or even reverse its motion. Figure 9-8 depicts the collision at one instant. The ball experiences a force ![]() (t) that varies during the collision and changes the linear momentum of
(t) that varies during the collision and changes the linear momentum of ![]() the ball. That change is related to the force by Newton’s second law written in the form
the ball. That change is related to the force by Newton’s second law written in the form ![]() . Thus, in time interval dt, the change in the ball’s momentum is
. Thus, in time interval dt, the change in the ball’s momentum is

We can find the net change in the ball’s momentum due to the collision if we integrate both sides of Eq. 9-28 from a time ti just before the collision to a time tf just after the collision:

The left side of this equation gives us the change in momentum: ![]() . The right side, which is a measure of both the magnitude and the duration of the collision force, is called the impulse
. The right side, which is a measure of both the magnitude and the duration of the collision force, is called the impulse ![]() of the collision:
of the collision:

Thus, the change in an object’s momentum is equal to the impulse on the object:

This expression can also be written in the vector form

and in such component forms as

and

If we have a function for ![]() (t), we can evaluate
(t), we can evaluate ![]() (and thus the change in momentum) by integrating the function. If we have a plot of
(and thus the change in momentum) by integrating the function. If we have a plot of ![]() versus time t, we can evaluate
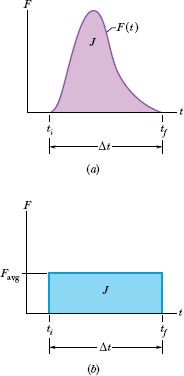
versus time t, we can evaluate ![]() by finding the area between the curve and the t axis, such as in Fig. 9-9a. In many situations we do not know how the force varies with time but we do know the average magnitude Favg of the force and the duration Δt (= tf − ti) of the collision. Then we can write the magnitude of the impulse as
by finding the area between the curve and the t axis, such as in Fig. 9-9a. In many situations we do not know how the force varies with time but we do know the average magnitude Favg of the force and the duration Δt (= tf − ti) of the collision. Then we can write the magnitude of the impulse as

The average force is plotted versus time as in Fig. 9-9b. The area under that curve is equal to the area under the curve for the actual force F(t) in Fig. 9-9a because both areas are equal to impulse magnitude J.
Instead of the ball, we could have focused on the bat in Fig. 9-8. At any instant, Newton’s third law tells us that the force on the bat has the same magnitude but the opposite direction as the force on the ball. From Eq. 9-30, this means that the impulse on the bat has the same magnitude but the opposite direction as the impulse on the ball.

Fig. 9-8 Force ![]() (t) acts on a ball as the ball and a bat collide.
(t) acts on a ball as the ball and a bat collide.

Fig. 9-9 (a) The curve shows the magnitude of the time-varying force F(t) that acts on the ball in the collision of Fig. 9-8. The area under the curve is equal to the magnitude of the impulse ![]() on the ball in the collision. (b) The height of the rectangle represents the average force Favg acting on the ball over the time interval Δt. The area within the rectangle is equal to the area under the curve in (a) and thus is also equal to the magnitude of the impulse
on the ball in the collision. (b) The height of the rectangle represents the average force Favg acting on the ball over the time interval Δt. The area within the rectangle is equal to the area under the curve in (a) and thus is also equal to the magnitude of the impulse ![]() in the collision.
in the collision.

Fig. 9-10 A steady stream of projectiles, with identical linear momenta, collides with a target, which is fixed in place. The average force Favg on the target is to the right and has a magnitude that depends on the rate at which the projectiles collide with the target or, equivalently, the rate at which mass collides with the target.
![]() CHECKPOINT 4 A paratrooper whose chute fails to open lands in snow; he is hurt slightly. Had he landed on bare ground, the stopping time would have been 10 times shorter and the collision lethal. Does the presence of the snow increase, decrease, or leave unchanged the values of (a) the paratrooper’s change in momentum, (b) the impulse stopping the paratrooper, and (c) the force stopping the paratrooper?
CHECKPOINT 4 A paratrooper whose chute fails to open lands in snow; he is hurt slightly. Had he landed on bare ground, the stopping time would have been 10 times shorter and the collision lethal. Does the presence of the snow increase, decrease, or leave unchanged the values of (a) the paratrooper’s change in momentum, (b) the impulse stopping the paratrooper, and (c) the force stopping the paratrooper?
Series of Collisions
Now let’s consider the force on a body when it undergoes a series of identical, repeated collisions. For example, as a prank, we might adjust one of those machines that fire tennis balls to fire them at a rapid rate directly at a wall. Each collision would produce a force on the wall, but that is not the force we are seeking. We want the average force Favg on the wall during the bombardment—that is, the average force during a large number of collisions.
In Fig. 9-10, a steady stream of projectile bodies, with identical mass m and linear momenta m![]() , moves along an x axis and collides with a target body that is fixed in place. Let n be the number of projectiles that collide in a time interval Δt. Because the motion is along only the x axis, we can use the components of the momenta along that axis. Thus, each projectile has initial momentum mv and undergoes a change Δp in linear momentum because of the collision. The total change in linear momentum for n projectiles during interval Δt is n Δp. The resulting impulse
, moves along an x axis and collides with a target body that is fixed in place. Let n be the number of projectiles that collide in a time interval Δt. Because the motion is along only the x axis, we can use the components of the momenta along that axis. Thus, each projectile has initial momentum mv and undergoes a change Δp in linear momentum because of the collision. The total change in linear momentum for n projectiles during interval Δt is n Δp. The resulting impulse ![]() on the target during Δt is along the x axis and has the same magnitude of n Δp but is in the opposite direction. We can write this relation in component form as
on the target during Δt is along the x axis and has the same magnitude of n Δp but is in the opposite direction. We can write this relation in component form as

where the minus sign indicates that J and Δp have opposite directions.
By rearranging Eq. 9-35 and substituting Eq. 9-36, we find the average force Favg acting on the target during the collisions:

This equation gives us Favg in terms of n/Δt, the rate at which the projectiles collide with the target, and Δv, the change in the velocity of those projectiles.
If the projectiles stop upon impact, then in Eq. 9-37 we can substitute, for Δv,

where vi (= v) and vf (= 0) are the velocities before and after the collision, respectively. If, instead, the projectiles bounce (rebound) directly backward from the target with no change in speed, then vf = −v and we can substitute

In time interval Δt, an amount of mass Δm = nm collides with the target. With this result, we can rewrite Eq. 9-37 as

This equation gives the average force Favg in terms of Δm/Δt, the rate at which mass collides with the target. Here again we can substitute for Δv from Eq. 9-38 or 9-39 depending on what the projectiles do.
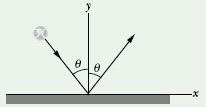
![]() CHECKPOINT 5 The figure shows an overhead view of a ball bouncing from a vertical wall without any change in its speed. Consider the change Δ
CHECKPOINT 5 The figure shows an overhead view of a ball bouncing from a vertical wall without any change in its speed. Consider the change Δ![]() in the ball’s linear momentum. (a) Is Δpx positive, negative, or zero? (b) Is Δpx positive, negative, or zero? (c) What is the direction of Δ
in the ball’s linear momentum. (a) Is Δpx positive, negative, or zero? (b) Is Δpx positive, negative, or zero? (c) What is the direction of Δ![]() ?
?

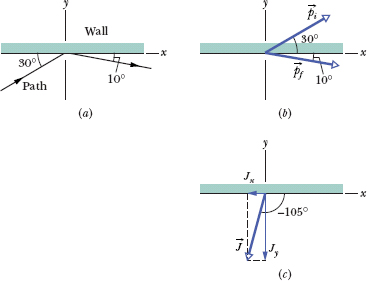
Figure 9-11a is an overhead view of the path taken by a race-car driver as his car collides with the racetrack wall. Just before the collision, he is traveling at speed vi = 70 m/s along a straight line at 30° from the wall. Just after the collision, he is traveling at speed vf = 50 m/s along a straight line at 10° from the wall. His mass m is 80 kg.
(a) What is the impulse ![]() on the driver due to the collision?
on the driver due to the collision?
Solution: We can treat the driver as a particle-like body and thus apply the physics of this section. However, we cannot calculate ![]() directly from Eq. 9-30 because we do not know anything about the force
directly from Eq. 9-30 because we do not know anything about the force ![]() (t) on the driver during the collision. That is, we do not have a function of
(t) on the driver during the collision. That is, we do not have a function of ![]() (t) or a plot for it and thus cannot integrate to find
(t) or a plot for it and thus cannot integrate to find ![]() .
.
However, a Key Idea here is that we can find ![]() from the change in the driver’s linear momentum
from the change in the driver’s linear momentum ![]() via Eq. 9-32 (
via Eq. 9-32 (![]()
![]() ). Figure 9-11b shows the driver’s momentum
). Figure 9-11b shows the driver’s momentum ![]() before the collision (at angle 30° from the positive x direction) and his momentum
before the collision (at angle 30° from the positive x direction) and his momentum ![]() after the collision (at angle −10°). From Eqs. 9-32 and 9-22 (
after the collision (at angle −10°). From Eqs. 9-32 and 9-22 (![]() = m
= m![]() ), we can write
), we can write

We could evaluate the right side of this equation directly on a vector-capable calculator because we know m is 80 kg, ![]() is 50 m/s at −10°, and
is 50 m/s at −10°, and ![]() is 70 m/s at 30°. Instead, here we evaluate Eq. 9-41 in component form. Along the x axis we have
is 70 m/s at 30°. Instead, here we evaluate Eq. 9-41 in component form. Along the x axis we have

Along the y axis,

The impulse is then

which means the impulse magnitude is

The angle of ![]() is given by
is given by


Fig. 9-11 (a) Overhead view of the path taken by a race car and its driver as the car slams into the racetrack wall. (b) The initial momentum ![]() and final momentum
and final momentum ![]() of the driver. (c) The impulse
of the driver. (c) The impulse ![]() on the driver during the collision.
on the driver during the collision.
which a calculator evaluates as 75.4°. Recall that the physically correct result of an inverse tangent might be the displayed answer plus 180°. We can tell which is correct here by drawing the components of ![]() (Fig. 9-11c). We find that θ is actually 75.4° + 180° = 255.4°, which we can write as
(Fig. 9-11c). We find that θ is actually 75.4° + 180° = 255.4°, which we can write as

(b) The collision lasts for 14 ms. What is the magnitude of the average force on the driver during the collision?
Solution: The Key Idea here is that, from Eq. 9-35, the magnitude Favg of the average force is the ratio of the impulse magnitude J to the duration Δt of the collision:

Using F = ma with m = 80 kg, you can show that the magnitude of the driver’s average acceleration during the collision is about 3.22 × 10³ m/s2 = 329g. We can guess that the collision will probably be fatal.
Mechanical engineers attempt to reduce the chances of a fatality by designing and building racetrack walls with more “give,” so that a collision lasts longer. For example, if the collision here lasted 10 times longer and the other data remained the same, the magnitudes of the average force and average acceleration would be 10 times less and probably survivable.
Leave a Reply