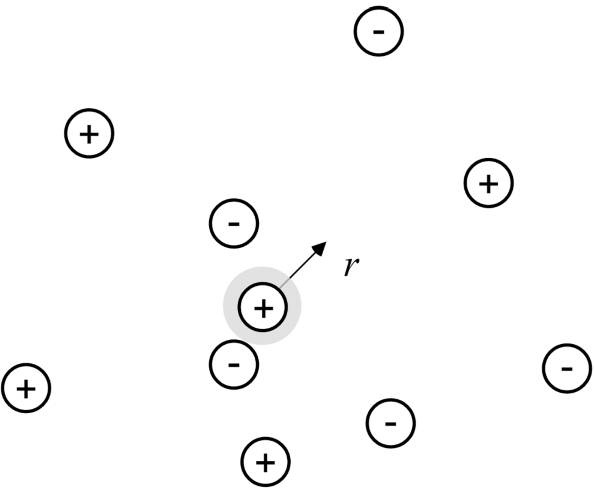
The previous section described a potential difference between a surface and the adjacent solution. This potential difference is due to unbalanced charge in solution as a result of charge on a surface or on an ion. Both of these situations (surface and ion) have been described in the literature using very similar approaches, and the key parameter that results is the same in both cases. Here we present the Debye–Hückel solution for the potential field surrounding a single charged central ion as shown in Figure 2.6. Our goal in presenting this material is to help you understand the basic physics of the problem and to introduce the Debye length. Later in this chapter we will use the solution developed here to provide a first approximation to the activity coefficient of an ion.

As shown in Figure 2.6, we shall evaluate the potential field surrounding a positively charged ion in solution. Ions near this central ion are affected by its charge, with negative ions drawn toward the central ion and positive ions pushed away. Ions in solution also experience random thermal motion, which tends to make the concentration more uniform. These two counteracting effects, the potential field, which tends to separate ions, and random thermal motion, which tends to make concentrations more uniform, can be expressed quantitatively by the Boltzmann factor:
The quantity ziFϕ represents the work required to move a mole of ions to a different energy state as characterized by the local potential. This expression correctly yields a concentration of negative ions near the central ion that is greater than the bulk concentration, and a concentration of positive ions near the central ion that is less than the bulk. Also, the expression is quite sensitive to the potential. For example, a potential difference of only 10 mV leads to an increase in concentration of the negative ions of almost 50%. Note that the treatment presented in this section ignores the discrete nature of the ions and treats the concentration distributions as continuous.
Far away from the central ion, the concentration is that of the bulk; here the potential, ϕ, is arbitrarily set to zero. The potential distribution is given by Poisson’s equation:
where ɛ is the permittivity with units [C·V−1·m−1]. Assuming spherical symmetry and substituting the Boltzmann distribution above (Equation 2.34) for the concentrations, Equation 2.35 becomes
where the summation is over each type of ion in solution. The boundary conditions are

The second boundary condition accounts for the fact that the charge density integrated throughout the volume surrounding the central ion must be equal to the charge of the central ion (zc). Consequently, according to Gauss’s law,
(2.37)![]()
where the potential gradient and the surface area of the ion are constants and can be removed from the integral. In order to simplify Equation 2.36, the exponential term is approximated by the first two terms of a Maclaurin series, which is accurate for small values of the term in the exponent.

Substituting this expression back into the original differential equation (Equation 2.36) results in
Here, the Debye length, λ, has been introduced. This parameter is critical in the study of electrochemical systems, and is defined as
The Debye length is important in describing the potential distribution; more specifically, it is the characteristic length over which the charge density in solution varies as a result of the central ion. The solution of (2.38) is
(2.40)
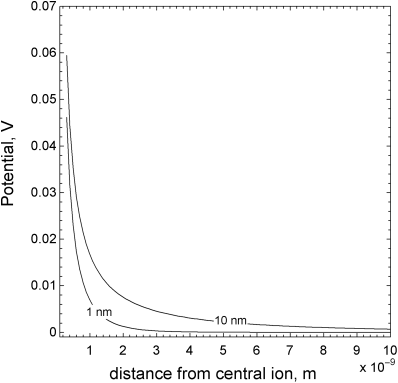
which represents the variation of the solution potential with position beginning at the surface of the central ion and moving outward. The Debye length characterizes the distance over which the potential changes as shown in Figure 2.7, where the potential in the less concentrated solution takes significantly longer to decay. The potential is the result of the field from the central ion and the shielding effects of other ions in solution. The Debye length decreases with increasing concentration (see Equation 2.39), as more ions are available to shield the central ion. Typical λ values in aqueous solutions are on the order of 1 nm. While a nanometer may seem quite small, this characteristic distance is large relative to other types of interaction forces between molecules. The variation of the charge density in solution as a result of charge on an electrode surface also scales with the Debye length as discussed later in Chapter 3.


Leave a Reply