tential as shown in Section 4.3. In that section, we solved for the potential drop in a one-dimensional (symmetric) geometry for fast kinetics. Previously, we examined the impact of the surface reaction on the potential losses at each of the two electrodes, in addition to losses associated with the ohmic drop in solution. Rapid kinetics leads to small surface overpotentials and voltage losses that are dominated by the solution. In contrast, surface overpotentials dominate the voltage losses for slow kinetics. How are these observations related to the current distribution in systems that are not geometrically symmetric?
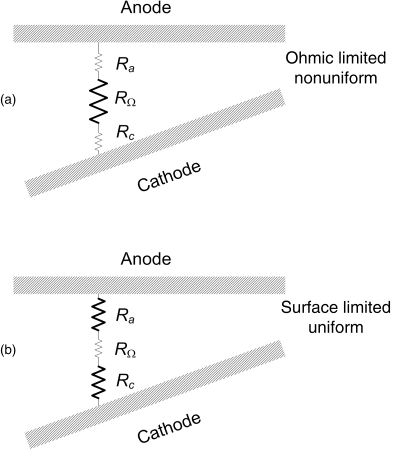
Figure 4.11 provides a conceptual view of the situation in terms of two types of resistances: ohmic resistance and charge-transfer resistance. The charge-transfer resistance occurs at the surface and does not depend on the geometry. In contrast, the ohmic resistance is strongly dependent on the geometry and is responsible for nonuniformities in the current distribution. Therefore, situations where the charge-transfer resistance dominates over the ohmic resistance result in a uniform current distribution. Conversely, situations where the ohmic resistance is dominant lead to a nonuniform current distribution (except, of course, in cases where the problem is geometrically symmetric). In Figure 4.11a, the current would be higher on the right where the electrodes are closer together. In contrast, the current would be nearly uniform over both electrodes when the surface resistance dominates as in Figure 4.11b.
Consider current flowing between two large, parallel plates separated by a distance L. The resistance between the plates is (see Equation 4.8c)
(4.61)![]()
The charge-transfer resistance can be expressed as
where ηs is the surface overpotential. The ratio of these two resistances is the dimensionless quantity known as the Wagner number, which is a measure of the uniformity of the current density.
(4.63)![]()
The change in the surface overpotential with respect to the current can be obtained from an expression for the kinetics. Beginning with the Butler–Volmer equation introduced in Chapter 3,

we consider the simplified expressions for linear and Tafel kinetics. The results are as follows (see Problem 4.20):
For Tafel kinetics, the average current density appears in the denominator of the Wagner number. Under these conditions, the charge-transfer resistance decreases with increasing current density due to the exponential nature of the current. In contrast, the exchange-current density appears in Equation 4.64 for linear kinetics. The resistance is independent of the current density for the linear region. In general, the current distribution becomes less uniform as the Wagner number decreases. When the Wa approaches zero, the kinetic resistance is no longer significant and the current distribution is controlled completely by the ohmic drop in solution. To summarize:
- In the absence of concentration gradients, the current distribution is influenced by kinetic and ohmic resistances.
- In situations where the kinetic resistance dominates, the current distribution tends to be uniform (Wa >>1).
- In situations where ohmic losses dominate, the current distribution tends to be nonuniform (Wa → 0).
Equations 4.64 and 4.65 also highlight the important factors in controlling the distribution of current. The current distribution can be made more uniform by (1) increasing the conductivity of the solution, by adding a supporting electrolyte for instance, (2) reducing the characteristic length L, (3) lowering the exchange-current density, perhaps by adding inhibitors to the electrolyte, and (4) keeping the average current density low. All of these techniques are used in practice.
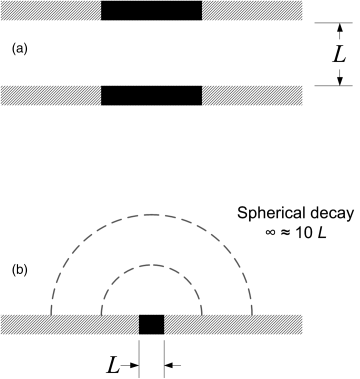
The choice of characteristic length for use in the Wa number is often not clear since there is frequently more than one possibility to consider. A couple of generalizations are helpful in making this choice. If the electrodes are similar in size, then the resistance is best characterized by the distance between them. In contrast, for a situation where the electrode of interest is smaller than the counter electrode and where spherical or cylindrical symmetry leads to decay of the potential field with increasing distance away from the electrode, the most appropriate length is the diameter or length of the small electrode. In such cases, the precise size and location of the counter electrode are not important since nearly all of the potential drop occurs within 5–10 radii of the small electrode. In all cases, if the electrodes are very far apart (>5L), the potential distribution near the electrode is not affected by the other electrode and a dimension characteristic of the electrode (L) should be used as the characteristic length. These generalizations are illustrated in Figure 4.12.
We can now provide some important definitions:
- Primary current distribution: The current distribution where Wa = 0 and kinetic resistances are not important. The distribution of the current depends entirely on ohmic losses in the electrolyte. Constant concentration is assumed and Laplace’s equation is solved for the potential field with constant potential boundary conditions at the electrodes.
- Secondary current distribution: The current distribution that is determined by including kinetics as a boundary condition when solving Laplace’s equation for the potential field. Also assumes constant concentration. This distribution approaches the primary current distribution when kinetics are extremely rapid.
- Tertiary current distribution. This distribution includes mass transfer, kinetics, and potential field effects. A fully coupled solution of the equations that describe all of these effects is required.
Primary Current Distribution Example (Wa = 0)
For the primary current distribution, the kinetic resistance is negligible. Under these conditions, the kinetics are sufficiently fast to be considered at equilibrium. Since the metal potential of the electrode is constant, this assumption implies that the solution just beyond the metal surface is also at a constant potential. Ohmic losses control the distribution and, since the conductivity is constant, the geometry dictates the current distribution as determined from Laplace’s equation.
For the primary current distribution we have two types of boundary conditions. The first is the constant potential boundary condition at the electrode as just described. The second boundary condition applies at insulating boundaries where there is no current flow. From Ohm’s law, the gradient of the potential normal to an insulating boundary is equal to zero.
Figure 4.13 shows the potential distribution for two parallel electrodes embedded in insulating walls, where the potential of the electrodes has been specified and the gradient of the potential at the insulating walls is zero. This problem can be solved analytically with use of the Schwarz–Christoffel transformation to yield the current distribution. A number of different analytical and numerical methods for solving Laplace’s equation for the primary current distribution are available, and solutions for a number of different geometries have been published. While analytical solutions are useful and perhaps even elegant, numerical solution with use of modern computational tools is quite straightforward and is probably the quickest way to solve a problem whose primary current distribution is not readily available. The results shown in figures 4.13 and 4.14 were determined numerically.
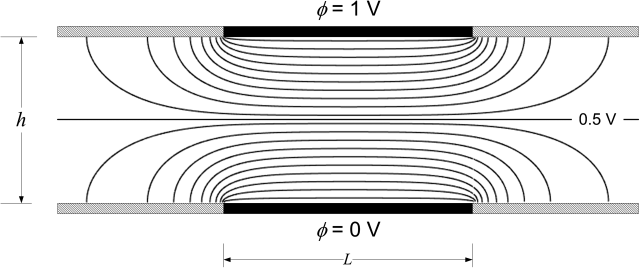
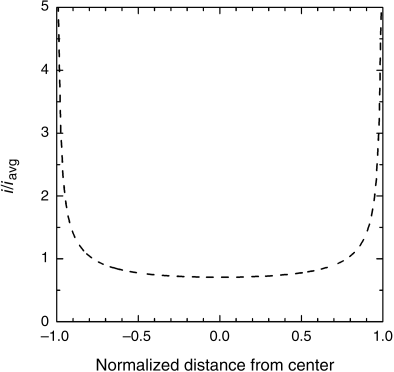
The current flows normal to the lines of constant potential. Therefore, the current flows out from the edges of the electrodes at right angles to the potential lines. At insulating surfaces, the lines of constant potential are perpendicular to the surface, corresponding to a zero gradient and hence zero current at those surfaces. Why is the current distribution so nonuniform (see Figure 4.14)? The answer is that there is much more area in which current can flow at the edges of the electrodes, and the current takes the path of least resistance. This path is a bit longer but less crowded. To illustrate, imagine that you and thousands of other people are trying to get into the stadium entrance to a sporting event. What do you do if you are in a hurry? You run along the outside of the crowd where things are not all jammed up with people, and then head for the outside edge of the entrance. That is what the current does and that is why the current at the edges is much higher. Basically, a much larger cross section of the electrolyte feeds the current on the outside of the electrodes.
A few general rules are illustrated by Figure 4.15. When the angle between an insulating surface and the electrode is less than 90°, the current density in the corner is zero. For an angle of 90°, the current is finite; for angles equal to or greater than 90°, the current density is infinite. This behavior has important implications for electrodeposition and electropolishing.

Secondary and Tertiary Current Distributions
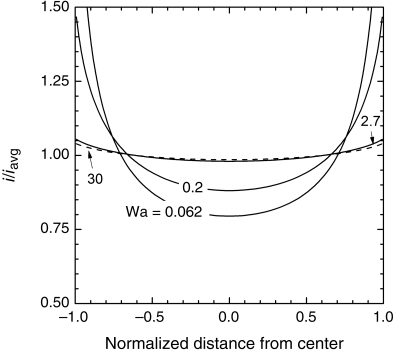
For the secondary distribution, kinetic resistances of the electrode reactions are included. As we discussed previously, the finite kinetics has the effect of smoothing out the current distribution. Since we still assume a uniform concentration in the electrolyte, Ohm’s law and Laplace’s equation apply. The difference is that the boundary conditions treat finite kinetics for the electrochemical reactions. There are analytical solutions for a few secondary current distributions that take advantage of simplified kinetics. However, most problems for the secondary current distribution involve nonlinear boundary conditions that are more easily addressed numerically. While the details of the solution are beyond the scope of this section, it is useful to examine the results for the parallel plate problem as a function of Wa number (Figure 4.16). For a uniform current distribution, the local current density and the average current density are equal (i/iavg = 1). As seen in the figure, the results for Wa = 30 are close to uniform. The figure also shows very little difference between the results for a Wagner number of 30 and those for Wa = 2.7. Thus, from an engineering perspective, efforts to increase Wa from 2.7 to 30 would not be warranted for this system. The nonuniformity of the current distribution at low Wa values is also apparent from the figure.
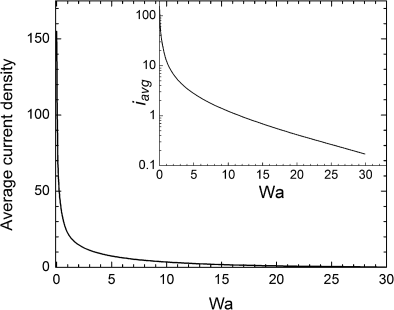
The normalized data in Figure 4.16 provide an accurate view of the current distribution. However, the price paid for uniformity is perhaps not obvious. Figure 4.17 shows the average current density that corresponds to each value of Wa. In this case, the average current was reduced by orders of magnitude in order to get a current distribution that was nearly uniform, with rapid changes occurring at very low Wagner numbers. The reduction in the average current means that, for example, the rate of electrodeposition has been dramatically reduced in order to make the current distribution more uniform. In situations where it is possible, it is advisable to start with a primary current distribution that is more nearly uniform in order to avoid the severe reductions in current observed here.
Finally, we have tertiary current distributions, which include concentration gradients and mass-transfer effects, which also impact the current distribution. Ohm’s law can no longer be used and, for all intents and purposes, numerical solutions are required.
Leave a Reply