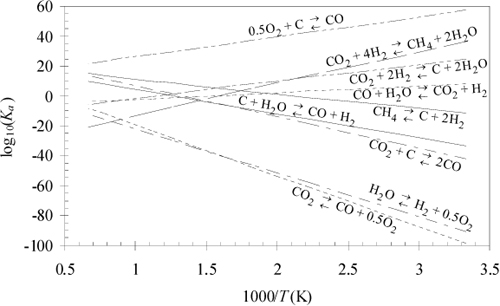
Plots of equilibrium constants provide a rapid method to visualize the gross trends and orders of magnitude. Fig. 17.2 illustrates how several reactions can be illustrated in a single graph. The equilibrium constants are calculated with the full temperature dependence. Note that the plots are nearly linear as would be approximated by the short-cut van’t Hoff. Exothermic reactions have a negative slope and endothermic reactions have a positive slope. When dealing frequently with a set of reactions, such a graph can serve as a “road map” where the optimal temperature window of operation maximizes desired products while minimizing by-products and potential coupling of reactions.

Figure 17.2. Graphical analysis of competing reactions.
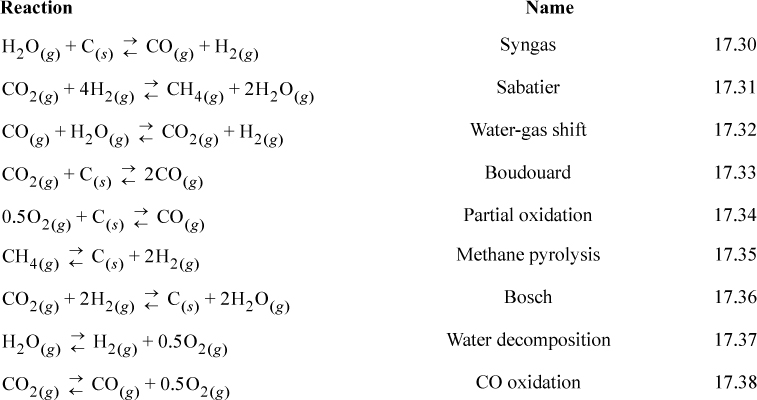
The reactions of Fig. 17.2 are typically involved in many high-profile applications including: combustion, chemical-vapor infiltration, reforming, coking during reforming, space station gas management, electrolysis, and the hydrogen economy. Several of these reactions have common names which are listed below.

To illustrate interpretation of the graph, consider an application of the above reactions to material management in space station gas management, where an objective is to remove CO2 and provide O2. There are many ways that the reactions could be combined. On a space station sunlight is relatively abundant. Therefore, high temperatures and solar cells are available, but food must be imported. Note that the Sabatier reaction would convert waste CO2 to fuel but requires H2. Fig. 17.2 shows that the equilibrium constant is favorable below 900 K. The Bosch reaction also favors products at temperatures below 900 K. The Bosch reaction produces graphitic carbon, which can be collected in dense form and conveniently disposed. The hydrogen required for the Bosch reaction could be generated by water decomposition, which could be achieved with electrolysis or pyrolysis, with the benefit of co-producing oxygen for respiration. A small extrapolation of Fig. 17.2 shows that water pyrolysis is favorable above 2300 K.2 Coupling the Sabatier reaction with methane pyrolysis has been suggested. Methane pyrolysis is favorable above 700 K. This would produce hydrogen for other use. Hydrogen production could also be achieved by the syngas reaction, if graphitic carbon was available. H2 could be enhanced and CO removed by the water-gas shift. Catalysts can selectively alter the kinetics to minimize undesired products, although they cannot alter the equilibrium constraints. Nevertheless, all combinations are constrained by material balances, which dictate the overall reactions.
This kind of reaction network analysis is typical of many applications. For example, some simple economic considerations show why producing hydrogen by steam reforming of methane (natural gas) is the preferred method compared to electrolysis. The energetic cost of water electrolysis raises serious doubts about electrolysis feasibility on Earth. With abundant electrical energy, it might be more appropriate to operate electric vehicles. It is not practical to articulate all the ways that this kind of network analysis can be applied to modern problems, but these illustrations should suggest the manner of proceeding for many such analyses. Noting that energies of reaction are an implicit part of the analysis, a tremendous wealth of information is implied by a single graph like Fig. 17.2. Later, in Section 17.11, we demonstrate how combining an unfavorable reaction with a strongly favorable reaction can help to drive the unfavorable reaction.
Leave a Reply