Expressions for activity coefficients are the same for LLE as they are for VLE. The difference is that multiple liquid compositions can give the same activities or total pressure at a given temperature. This behavior is implied in Fig. 11.10, where we commented that the calculated lines indicate LLE. The time has come to analyze why this happens and how to properly represent the phase behavior of a system with two liquid phases.
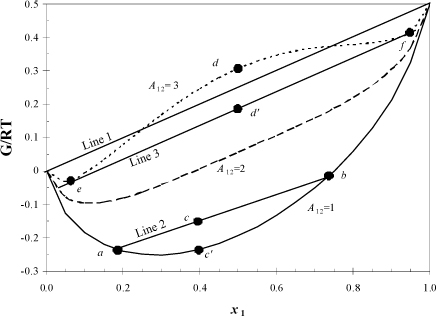
Keep in mind that nature dictates phase stability by minimizing the Gibbs energy when T and P are fixed. Gibbs energies of mixtures using the one-parameter Margules equation for three values of A12 are plotted in Fig. 14.1 (the curves). In this plot, the important quantity is the Gibbs energy of the mixture G. In Fig. 14.1, the endpoints represent the values of Gi = Hi – TSi for the pure components, where the references states have been arbitrarily chosen, and only component 2 is at its reference state. If we imagine computing the Gibbs energy of two separate beakers containing the two separate components on the basis of one mole of total fluid, we see that this overall molar Gibbs energy is simply a molar average of the two component Gibbs energies along line 1 in the plot. There is no contribution from the entropy of mixing, because they are not mixing; they are in separate beakers. Substituting (1–x1) for x2 in this molar average formula shows that this formula is simply a linear relation in terms of x1. Deviations from this line are the changes due to the mixing process. Note how the shape of the Gibbs energy changes with the value of A12. Since ![]() , then rearranging,
, then rearranging,


Figure 14.1. Illustration of the Gibbs energy of a mixture represented by the Margules one-parameter equation.
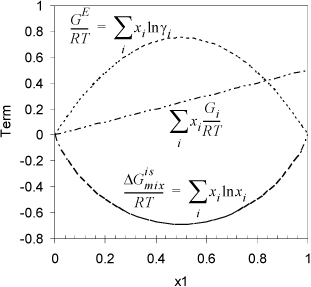
where the last term represents the sum of component enthalpies represented by the upper straight line. The increasing excess Gibbs energy of mixing (larger A12) ultimately causes a “w-shaped” curve to form. The individual contributions of Eqn. 14.3 to the Gibbs energy are shown in Fig. 14.2.

Figure 14.2. Illustration of the contributions to the Gibbs energy of a binary mixture when A12 = 3 and the pure component Gibbs energies are as in Fig. 14.1.
The procedure of summing together Gibbs energies along a line also applies to any tie line. As shown in Fig. 14.1, A12 = 1 leads to a situation where connecting any two compositions by a straight line gives a value of G at the overall composition that is higher than the G along the curve. Line 2 on the plot shows this for a mixture with an overall composition z1 = 0.4 and assuming that two phases are formed x1α ≈ 0.17 (point a) and x1β ≈ 0.74 (point b). The overall Gibbs energy would be given by point c on the tie line, G/RT = –0.15. However, if the mixture stays as one phase, along the mixture line the Gibbs energy would be G/RT = –0.23 (point c’), a lower value, which means this is more stable. (Note that c’ must be at the overall composition along the line, z1 = 0.4.) Since the curve for A12 = 1 is concave up, a straight line between two points always gives a higher value for two phases.
![]() A system will split into two phases if it results in a lower Gibbs energy.
A system will split into two phases if it results in a lower Gibbs energy.
This situation is quite different when we consider the case where A12 = 3. Along this curve, the mixture at z1 = 0.5 would have G ≈ 0.31, (point d), if it remained as a single phase. However, if the solution splits into two phases, line 3 can be drawn between the compositions of the phases (one point on either side of d) as shown by points e ![]() and
and ![]() , and the overall energy is given by the intersection of this line with the overall composition z1 = 0.5 as shown by point d’. The lowest energy is obtained when the line is tangent to the humps as shown in the figure, where G/RT ≈ 0.18, (point d’). Then, by splitting into two phases, the system clearly has a lower value for G/RT. Any other line that is drawn would force point d’ to have a higher Gibbs energy than this point. (Try it.) Considering these points at different values of A12 indicates that there is no phase split unless there is a hump in G/RT that makes it concave down. Note that A12 must be positive to create this curvature. This means that the activity coefficients must be greater than one, and the system must also have positive deviations from Raoult’s law for VLE.
, and the overall energy is given by the intersection of this line with the overall composition z1 = 0.5 as shown by point d’. The lowest energy is obtained when the line is tangent to the humps as shown in the figure, where G/RT ≈ 0.18, (point d’). Then, by splitting into two phases, the system clearly has a lower value for G/RT. Any other line that is drawn would force point d’ to have a higher Gibbs energy than this point. (Try it.) Considering these points at different values of A12 indicates that there is no phase split unless there is a hump in G/RT that makes it concave down. Note that A12 must be positive to create this curvature. This means that the activity coefficients must be greater than one, and the system must also have positive deviations from Raoult’s law for VLE.
One more point needs to be made before working some examples. Note that the line construction seems similar to what was done for VLE in a flash calculation at the beginning of Chapter 10. In fact, this is completely analogous mathematically to the flash in those diagrams, and the lever rule applies. The ratios of the phases can be found in a similar fashion. The only difference is that two liquid phases are formed upon a liquid-liquid flash rather than a vapor and liquid flash. For the example in the figure above, the fraction of the overall mixture that is the α phase (left side of diagram) is given by ![]() , so the mixture of this example splits into equal portions of the two phases. Note that the compositions for points e and f are the same for any overall composition between the two points. So a different overall composition in a binary mixture shifts the relative amounts of the two phases, but not their composition. (This simplification does not hold for more components; the Gibbs phase rule says F = C – P + 2.)
, so the mixture of this example splits into equal portions of the two phases. Note that the compositions for points e and f are the same for any overall composition between the two points. So a different overall composition in a binary mixture shifts the relative amounts of the two phases, but not their composition. (This simplification does not hold for more components; the Gibbs phase rule says F = C – P + 2.)
Leave a Reply