Phase Behavior
16.1. A binary mixture obeys a simple one-term equation for excess Gibbs energy, GE = Ax1x2, where A is a function of temperature: A = 2930 + 5.02E5/T(K) J/mol.
a. Does this system exhibit partial immiscibility? If so, over what temperature range?
b. Suppose component 1 has a normal boiling temperature of 310 K, and component 2 has a normal boiling temperature of 345 K. The enthalpies of vaporization are equal, both being 4475 cal/mol. Sketch a qualitatively correct T-x-y diagram including all LLE, VLE behavior at 1 bar.
16.2. As the research scientist of a company where phase equilibria is under study, you are approached by a laboratory technician with the most recent (and incomplete) high pressure phase equilibria results. The technician expresses concern that the data have not been collected correctly, or that some of the samples may have been mislabeled for some of the runs, or there is a problem with the automated equipment, because the data appear different from what he has seen before. The most recent results are summarized on the two P-x-y diagrams over the same P range shown below at T1 and T2, where T1< T2. The circles and triangles give coexisting phase compositions at each pressure. What is your response?

16.3. Using the value kij = 0.084 fitted to the system methanol(1) + benzene(2), use the Peng-Robinson equation to plot P-x-y behavior of the system at the following temperatures: 350 K, 500 K, 520 K. Plot the T-x-y behavior at the following pressures: 0.15 MPa, 2 MPa, 5.5 MPa. Sketch the P-T projection of the system.
16.4. Use UNIFAC to model the methanol(1) + methylcyclohexane(2) system. Provide a P-x-y diagram at 60°C and 90°C, and a T-x-y at 0.1013 MPa.
16.5. Use UNIFAC to model the methanol(1) + hexane(2) system. Provide a P-x-y diagram at 50°C and 25°C, and a T-x-y at 0.1013 MPa.
16.6. Model the system CO2(1) + tetralin(2) using kij = 0.10. Generate a P-x-y diagram at 20°C, 45°C, and a T-x-y at 12 MPa and 22 MPa. What type of phase behavior does the system exhibit?40
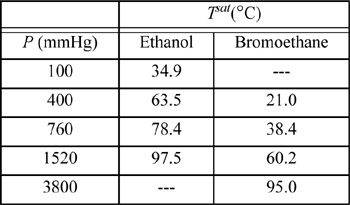
16.7. The system ethanol(1) + bromoethane(2) forms an azeotrope containing 93.2 mol% bromoethane and having a minimum boiling point of 37.0°C at 760 mmHg. The following vapor pressure data are available:

a. Use all of the available data to determine coefficients for equation log10 Psat = A + B/T by performing a linear regression to find the coefficients A and B. Be sure to use temperature in Kelvin.
b. Use the azeotropic point to determine the parameters for the van Laar equation.
c. Generate a P-x-y diagram at 100°C. Tabulate the data used to plot the diagram.
d. Generate a T-x-y diagram at 760 mmHg. Assume that the activity coefficients are independent of temperature over the range of temperature involved. (This is the type of calculation necessary for generating an x-y diagram for a distillation at 760 mmHg.)
e. Experimentally, the system is found to have a homogeneous maximum pressure azeotrope (Smyth, C.P., Engel, E.W. 1929. J. Am. Chem. Soc., 51:2660). How does this compare with your findings?
16.8. Benzaldehyde is known in the flavor industry as bitter almond oil. It has a cherry or almond essence. It may be possible to recover it using CO2 for a portion of the processing. Explore the phase behavior of the CO2(1) + benzaldehyde(2) system, using the Peng-Robinson equation to categorize the system among the types discussed in this chapter. Experimental data are not available, so use an interaction coefficient kij = 0.1, which has been fitted to the CO2-benzene system. Calculate P-x-y diagrams at 295 K and 323 K. Also determine T-x-y diagrams at 34.5 bar and 206.9 bar. Note that 34.5 bar is below the critical pressure of both substances. If a bubble calculation fails, try a dew, and vice versa.
Residue Curves
16.9. For the systems specified below, obtain residue curve maps and plot the range of possible distillate and bottoms compositions for the given feeds. UNIQUAC parameters are provided.
a. methanol(1) + ethanol(2) + ethyl acetate(3), z1 = 0.25, z2 = 0.25, r = [1.4311, 2.1055, 3.4786], q = [1.432, 1.972, 3.116], a parameters (in K); a12 = –91.226, a21 = 124.485, a13 = –74.2746, a31 = 389.285, a23 = –31.5531, a32 = 183.154.0
Note: Aspen 2006 gives poor VLE using LLE parameters for this system. Use the provided parameters.
b. Solve part (a), but use z1 = 0.4, z2 = 0.4, z3 = 0.2.
c. methanol(1) + 2-propanol(2) + water(3), z1 = 0.2, z2 = 0.6, z3 = 0.2, r = [1.4311, 2.7791, 0.92], q = [1.432, 2.508, 1.4], a parameters (in K); a12 = 39.717, a21 = –26.6935, a13 = –112.697, a31 = 176.077, a23 = 151.061, a32 = 55.1272.
d. Solve part (c), but use z1 = 0.6, z2 = 0.2, z3 = 0.2.
e. methanol(1) + ethanol(2) + benzene(3), z1 = 0.25, z2 = 0.25, z3 = 0.5, r = [1.4311, 2.1055, 3.1878], q = [1.432, 1.972, 2.4], a parameters (in K); a12 = –91.2264, a21 = 124.485, a13 = –27.2253, a31 = 559.486, a23 = –42.6567, a32 = 337.739.
f. Solve part (e), but use z1 = 0.4, z2 = 0.4, z3 = 0.2.
16.10. Consider an equimolar mixture of methanol(1) + water(2) + acetone(3). Demonstrate that it is not possible to obtain pure acetone as distillate from a single-feed column by generating a residue curve map and applying the bow-tie approximation.41 What compositions are attainable from this feed? Data: r = [1.4311, 0.92, 2.5735], q = [1.432, 1.4, 2.3360], = a parameters (in K); a12 = –112.697, a13 = –50.9396, a21 = 176.077, a23 = 29.1681, a31 = 218.872, a32 = 228.990.CopycopyHighlighthighlightAdd NotenoteGet Linklink
Leave a Reply