We have previously introduced the energy balance in Section 3.6 and also discussed adiabatic reactors. In this section we consider that there may be a there is a maximum possible value of ξ (outlet conversion) due to chemical equilibrium. Equilibrium may affect both adiabatic and nonadiabatic reactors, but we cover adiabatic reactors, and the extension to nonadiabatic should be obvious with the inclusion of the heat term.
Adiabatic Reactors
The energy balance for a steady-state adiabatic flow reactor is given in Eqn. 3.53 on page 118. The variables Tout and ![]() from the energy balance also appear in the equilibrium constraint that will govern maximum conversion. Earlier, in Chapter 3, we considered the reaction coordinate to be specified. However, in a reaction-limited adiabatic reactor, we must solve the energy balance together with the equilibrium constraint to simultaneously determine the maximum conversion and adiabatic outlet temperature. Using the energy balance from Eqn. 3.53, do the following.
from the energy balance also appear in the equilibrium constraint that will govern maximum conversion. Earlier, in Chapter 3, we considered the reaction coordinate to be specified. However, in a reaction-limited adiabatic reactor, we must solve the energy balance together with the equilibrium constraint to simultaneously determine the maximum conversion and adiabatic outlet temperature. Using the energy balance from Eqn. 3.53, do the following.
1. Write the energy balance, Eqn 3.53. Calculate the enthalpy of the inlet components at Tin.
2. Guess the outlet temperature, Tout. Calculate the enthalpy of the outlet components at Tout.
3. Determine ![]() at Tout using the chemical equilibrium constant constraint.
at Tout using the chemical equilibrium constant constraint.
4. Calculate ![]() for this conversion.
for this conversion.
5. Check the energy balance for closure.
6. If the energy balance does not close, go to step 2.
As you might expect, this type of calculation lends itself to numerical solution, such as the Solver in Excel.
Example 17.9. Adiabatic reaction in an ammonia reactor
Estimate the outlet temperature and equilibrium mole fraction of ammonia synthesized from a stoichiometric ratio of N2 and H2 fed at 400 K and reacted at 100 bar. How would these change if the pressure was 200 bar?

Solution
For a rough estimate we will use the shortcut approximation of temperature effects. Furthermore, we will assume Kϕ ≈ 1. (Is this a good approximation or not?a) Therefore we obtain,

Basis: Stoichiometric ratio in feed.

For the purposes of the example, the shortcut van’t Hoff equation will be used to iterate on the adiabatic reactor temperature. However, the full van’t Hoff method will be used to obtain ![]() and
and ![]() at an estimated nearby temperature Tnear = 600K as suggested in Section 17.8. Then the shortcut van’t Hoff equation will be used over a limited temperature range for less error. The energy balance will also use
at an estimated nearby temperature Tnear = 600K as suggested in Section 17.8. Then the shortcut van’t Hoff equation will be used over a limited temperature range for less error. The energy balance will also use ![]() ; we will create an energy balance path through Tnear = 600K rather than 298.15K. We will compare the approximate answer with the full van’t Hoff method at the end of the example.
; we will create an energy balance path through Tnear = 600K rather than 298.15K. We will compare the approximate answer with the full van’t Hoff method at the end of the example.
For ammonia, ![]() ,
, ![]() . Since the reactants are in the pure state, the respective reactant formation values are zero, and therefore the formation values for ammonia represent the standard state values for the reaction. Inserting the formation values along with the heat capacities into the detailed van’t Hoff equation—one of the Ka calculators highlighted in the margin note to Example 17.4 on page 653 is used—at an assumed temperature of 600 K, the values obtained are
. Since the reactants are in the pure state, the respective reactant formation values are zero, and therefore the formation values for ammonia represent the standard state values for the reaction. Inserting the formation values along with the heat capacities into the detailed van’t Hoff equation—one of the Ka calculators highlighted in the margin note to Example 17.4 on page 653 is used—at an assumed temperature of 600 K, the values obtained are ![]() and Ka,600 = 0.0417659. Then the shortcut van’t Hoff in the vicinity will be
and Ka,600 = 0.0417659. Then the shortcut van’t Hoff in the vicinity will be

From an assumed value of T, this equation will provide the equilibrium constant. Some manipulation is necessary to obtain the material balance from Ka,T. Plugging the mole fraction expressions into Eqn. 17.17, and collecting the fractions 1/2 and 3/2,

defining ![]()
Applying the quadratic formula,

The strategy will be to guess T, and calculate Ka,T, M, and ![]() .
. ![]() will be used in Eqn. 17.46 to perform the material balance. The material balance will be combined with the energy balance using the Heat of Reaction method (cf. Example 3.6), until the energy balance closes as represented by:
will be used in Eqn. 17.46 to perform the material balance. The material balance will be combined with the energy balance using the Heat of Reaction method (cf. Example 3.6), until the energy balance closes as represented by:

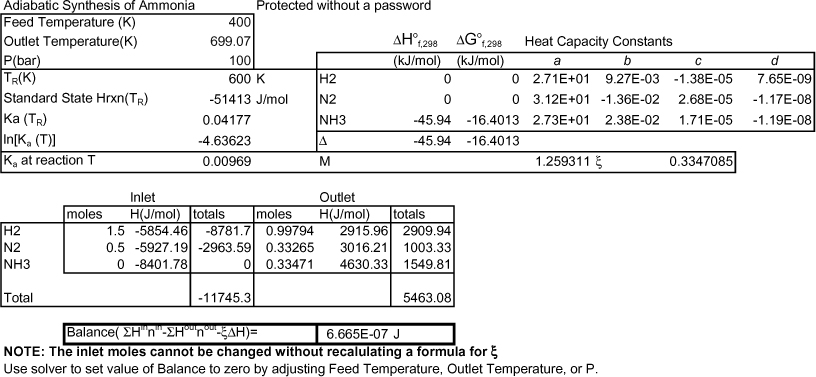
Heat capacity integrals and the energy balance have been entered in the workbook Rxns.xlsx. At the initial guess of 600 K, the F(T) of Eqn. 17.49 is 19.4 kJ. A converged result is found at 699 K shown in Fig. 17.4 and the ![]() = 0.33, conversion of feed is 33%. At 200 bar, the answer is 739 K, and conversion is 38%.
= 0.33, conversion of feed is 33%. At 200 bar, the answer is 739 K, and conversion is 38%.

Figure 17.4. Display from Rxns.xlsx showing a converged answer.
![]() Workbook Rxns.xlsx, worksheet RxnAdia-shortcut or MATLAB Ex17_09.m.
Workbook Rxns.xlsx, worksheet RxnAdia-shortcut or MATLAB Ex17_09.m.
The detailed van’t Hoff is available in the same workbook and results in 698 K and 33% conversion at 100 bar, and 737 K and 37% conversion at 200 bar.
a. We can evaluate this assumption by calculating the reduced temperatures at the end of our calculation and estimating the virial coefficients, then fugacity coefficients.
Graphical Visualization of the Energy Balance
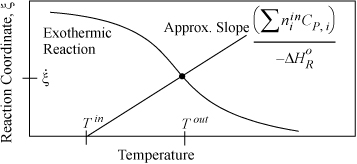
The energy balance is presented in Fig. 3.6 on page 119. The difference here is that the appropriate curve from Fig. 3.6 is superimposed on the plot and the outlet conversion and outlet temperature are determined by the intersection of the energy balance line and the equilibrium line. Fig. 17.5 illustrates an exothermic reaction. In the event that the reaction does not reach equilibrium because of kinetic limitations, the reaction coordinate must be located along the energy balance line below the equilibrium value. For the case of the ammonia reaction, the equilibrium constraint curve could be generated by inserting various temperatures in Eqn. 17.47 and then determining the reaction coordinate from Eqn. 17.48. The energy balance is plotted using Eqn. 3.55. The dot in the figure represents the point where the energy balance and equilibrium constraint are both satisfied. Note that an endothermic reaction will have an energy balance with a negative slope, and the equilibrium line will change shape as shown in Fig. 3.6, making the plot for an endothermic reaction a mirror image of Fig. 17.5 reflected across a vertical line at Tin.

Figure 17.5. Approximate energy balance for an exothermic reaction. The dot simultaneously represents the equilibrium outlet conversion and reaction coordinate value at the adiabatic outlet temperature. The plot for an endothermic reaction will be a mirror image of this figure as explained in the text.
Leave a Reply