The principle of calculation of the fugacity coefficient is the same by all methods—Eqn. 9.23 or 9.24 is evaluated. The methods look considerably different, usually because the P–V–T properties are summarized differently. All methods use the formula below and differ only in the manner the fugacity coefficient is evaluated.

Equations of State
Equations of state are the dominant method used in process simulators because the EOS can be solved rapidly by computer. We consider two equations of state, the virial equation and the Peng-Robinson equation. We also consider the generalized compressibility factor charts as calculated with the Lee-Kesler equation.
Ideal Gas

The Virial Equation
The virial equation may be used to represent the compressibility factor in the low-to-moderate pressure region where Z is linear with pressure at constant temperature. Eqn. 7.10 should be used to evaluate the appropriateness of the virial coefficient method. Substituting Z = 1 + BP/RT, or Z – 1 = BP/RT into Eqn. 9.23,

Thus,

![]() The virial equation for gases.
The virial equation for gases.
Writing the virial coefficient in reduced temperature and pressure,

where B0 and B1 are the virial coefficient correlations given in Eqns. 7.8 and 7.9 on page 259.
The Peng-Robinson Equation
Cubic equations of state are particularly useful in the petroleum and hydrocarbon-processing industries because they may be used to represent both vapor and liquid phases. Chapter 7 discussed how equations of state may be used to represent the volumetric properties of gases. The integral of Eqn. 9.23 is difficult to use for pressure-explicit equations of state; therefore, it is solved in the format of Eqn. 9.24. The integral is evaluated analytically by methods of Chapter 8. In fact, the result of Example 8.6 on page 317 is ln ϕ according to the Peng-Robinson equation.

To apply, the technique is analogous to the calculation of departure functions. At a given P, T, the cubic equation is solved for Z, and the result is used to calculate ϕ and then fugacity is calculated, f = ϕP. This method has been programmed into Preos.xlsx and Preos.m.
Below the critical temperature, equations of state may also be used to predict vapor pressure, saturated vapor volume, and saturated liquid volume, as well as liquid volumetric properties. While Eqn. 9.33 can be used to calculate fugacity coefficients for liquids, the details of the calculation will be discussed in the next section. Note again that Eqn. 9.24 is closely related to Eqn. 8.26 as used in Example 8.6 on page 317.
Generalized Charts
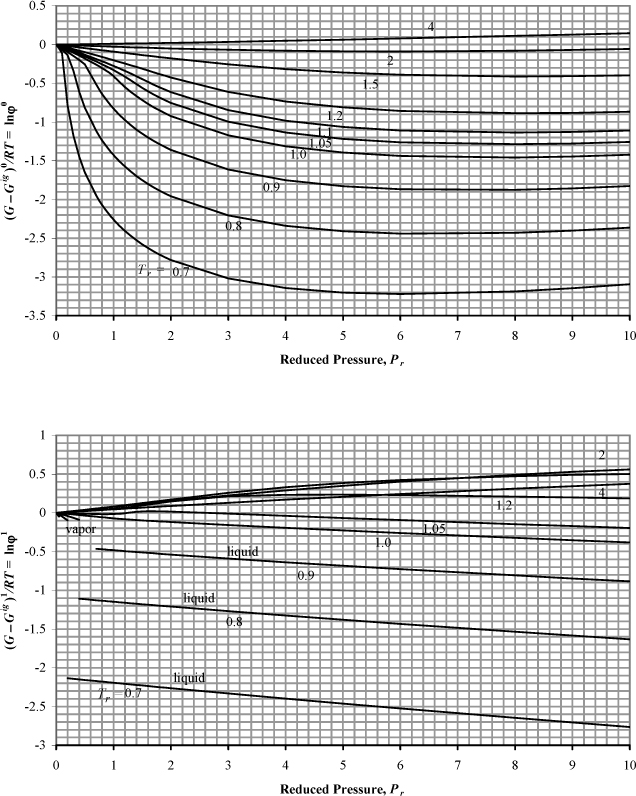
Properties represented by generalized charts may help to visualize the magnitudes of the fugacity coefficient in various regions of temperature and pressure. To use the generalized chart, we write

The Gibbs energy departure chart can be generated from the Lee-Kesler equation by specifying a particular value for the acentric factor. The charts are for the correlation ln ϕ = ln ϕ0 + ωln ϕ1. The entropy departure can also be estimated by combining Fig. 9.4 with Fig. 8.7:


Figure 9.4. Generalized charts for estimating the Gibbs departure function using the Lee-Kesler equation of state. (G – Gig)0/RT uses ω = 0.0, and (G – Gig)1/RT is the correction factor for a hypothetical compound with ω = 1.0.
Fig. 9.4 can be useful for hand calculation, if you do not have a computer. A sample calculation for propane at 463.15 and 2.5 MPa gives

compared to the value of –0.112 from the Peng-Robinson equation.
Leave a Reply